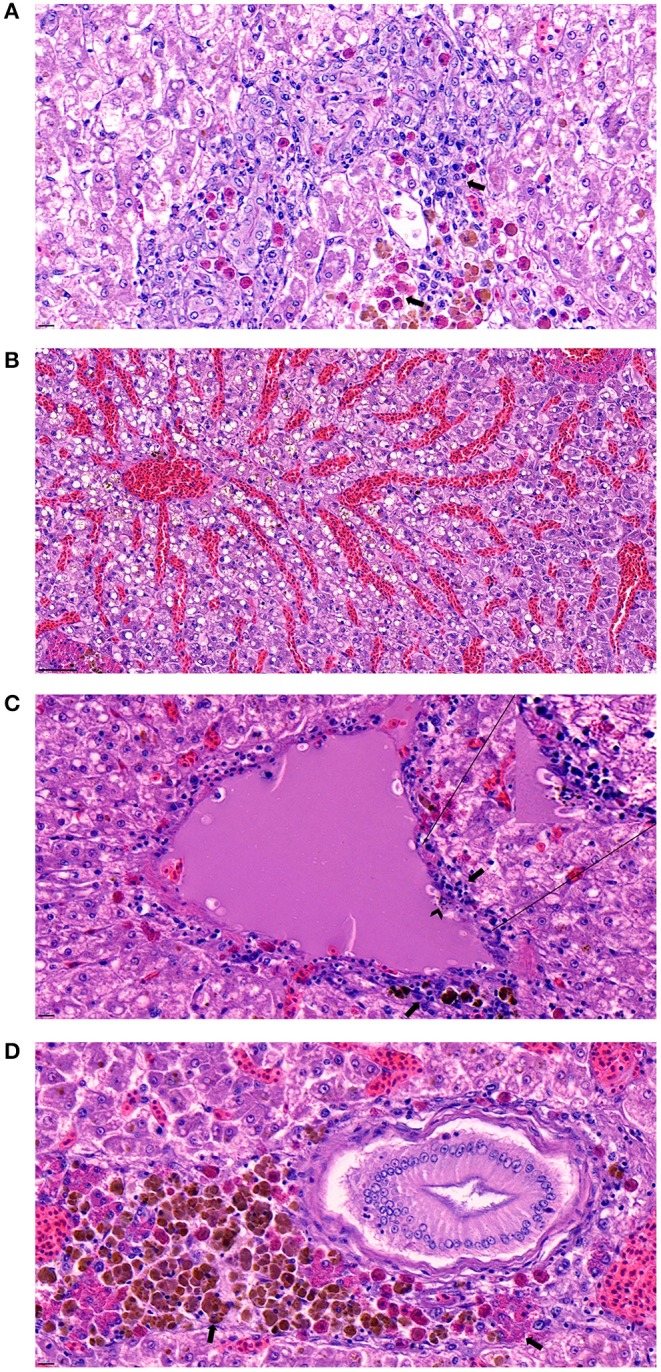
Figure 3.

(A) Signs of necrotizing areas in liver with cytoplasmic vacuolation accompanied by phagocytized bacterial rods, heterophils, and melanomacrophages (arrow) surrounding the area (Scale bar indicating 10 μm). (B) Sever congestion observed in liver of infected fish (Scale bar indicating 50 μm). (C) Signs of vasculitis with cellular debris (arrow) accompanied by diverse immunocyte infiltration surrounding the vessel and macrophage phagocytized bacterial rods (arrowhead) detected in the area (Scale bar indicating 10 μm). (D) Melanomacrophage and heterophils (arrow) concentrated around a bile duct on the liver (Scale bar indicating 10 μm).
