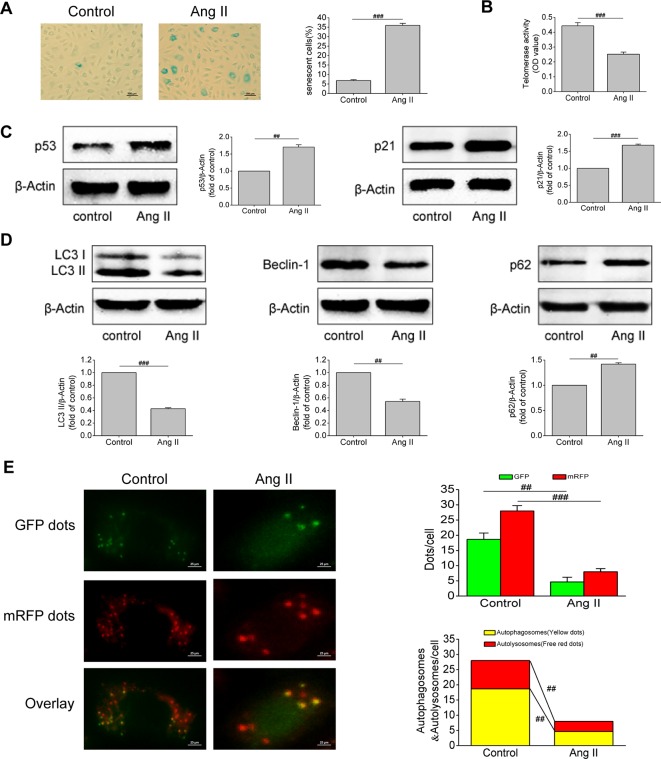
Figure 2.
Ang II triggered off EPCs senescence and inhibited EPCs autophagy. (A) Representative images and quantitative analysis of SA-β-gal activity assay (100× magnification). (B) Telomerase activity was determined by telomeric repeat amplification protocol assay and indicated by the difference value (OD = A450-A690). (C) Western blot analysis of the expression of p53 and p21 in EPCs in the absence or presence of Ang II. The data was presented in fold of control. (D) Western blot analysis of the expression of LC3-II, beclin-1 and p62 in EPCs in the absence or presence of Ang II. The data was presented in fold of control. (E) Representative images and quantitative analysis of mRFP-GFP-LC3 immunofluorescence (400× magnification). All data were pooled as mean ± S.D. (error bars) from three independent biological repeats experiments, each of which included 4 technical repeats. ##P < 0.01; ###P < 0.001.

