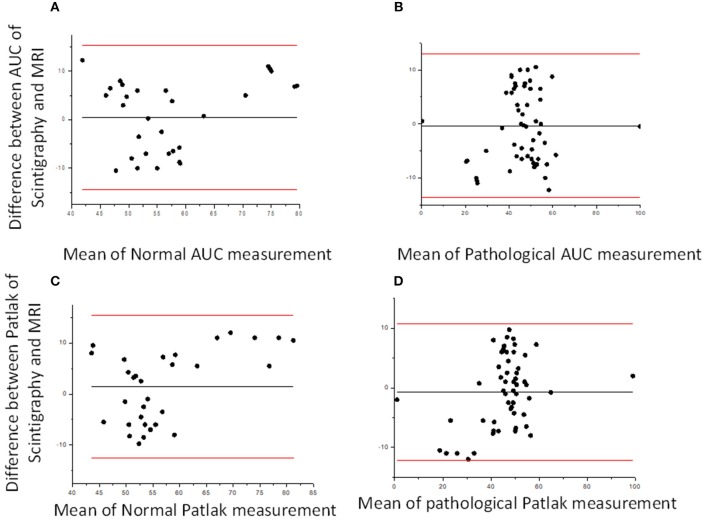
Figure 2.
Bland–Altman plots. Bland–Altman plot comparing DRS and functional MR urography measurement in Area Under the Curve (AUC) (A,B) and Patlak (C,D) for normal and pathological kidney, respectively. The solid lines represent, respectively, mean, upper and lower limits of the agreement for each parameter considered.

