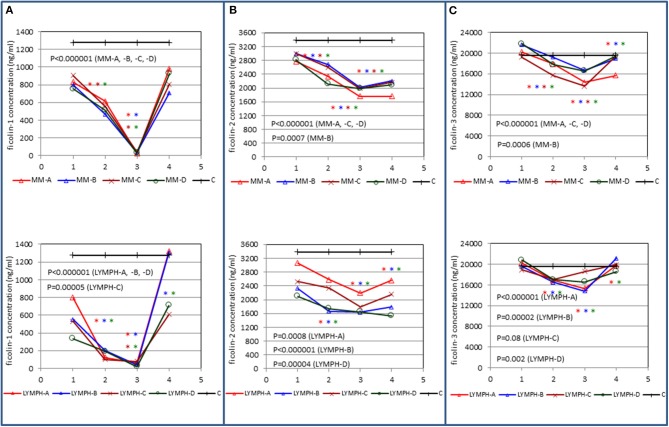
Figure 4.
Changes in concentrations of ficolin-1 (A), ficolin-2 (B), and ficolin-3 (C) in patients, during treatment. 1—blood taken directly before conditioning chemotherapy; 2— blood taken directly before autologous hematopoietic stem cell transplantation; 3—blood taken 1 week after HSCT; 4—blood taken 2 weeks after HSCT. Data from sample 5 (3 weeks after HSCT) are not shown due to relatively low number of cases within each subgroup. Median values for each time-point are presented. MM-A, LYMPH-A, patients who experienced infections with proven bacteremia; MM-B, LYMPH-B, patients who experienced infections with no bacteremia; MM-C, LYMPH-C, patients who experienced febrile neutropenia; MM-D, LYMPH-D, patients who experienced none of afore-mentioned complications during hospital stay. C—controls (sampled once). Statistics: given p-values regard to Friedman's ANOVA while asterisks (in colors corresponding to curves) mark significant differences in comparison with sample 1 (Wilcoxon's paired sample test). Graphs show data from complete sets (levels of ficolins measured in all one to four samples) only.

