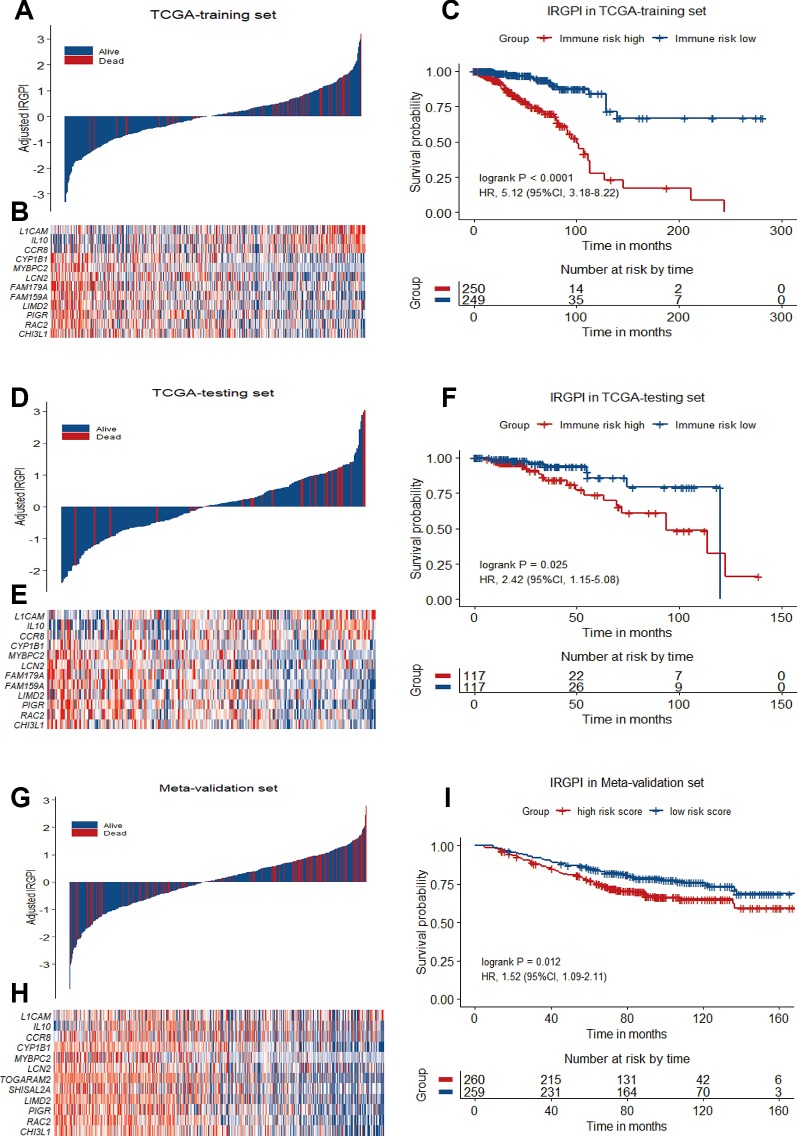
Figure 3.
12-gene prognostic signature biomarker characteristics in TCGA training set, TCGA testing set and Meta-validation set. (A), (D) and (G) Breast cancer were ranked by immune risk scores in the TCGA training set, TCGA testing set and Meta-validation set. (B), (E) and (H) Heatmap of 12 genes related to IRGPI differentially expressed between high and low immune risk groups in the TCGA training set, TCGA testing set and Meta-validation set, with red indicating higher expression and blue indicating lower expression. Patients were stratified by immune-related gene prognostic index (IRGPI) (low immune risk vs. high immune risk). (C), (F), and (I) Kaplan−Meier curves of overall survival (OS) among different IRGPI risk groups in TCGA training set, TCGA testing set and meta-validation set. Hazard ratios (HRs) and 95% CIs are for high immune risk group vs. low immune risk group. P values comparing risk groups were calculated with the log-rank test.

