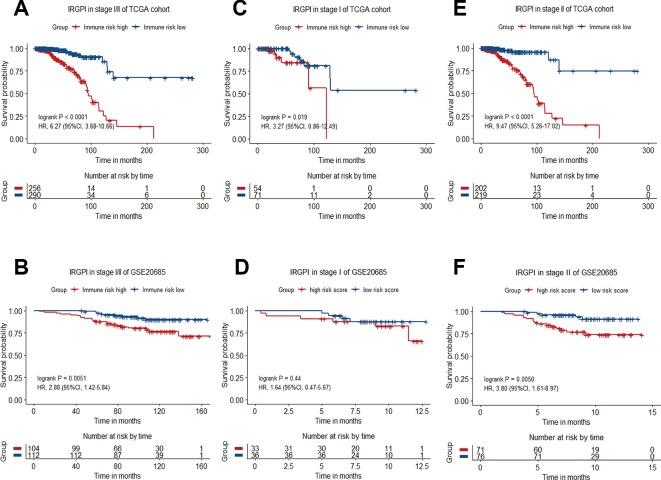
Figure 4.
Kaplan−Meier curve of overall survival (OS) for breast cancer patients with different IRGPI risks. (A) Survival curve of stage I/II patients of TCGA cohort. (B) Survival curve of stage I/II patients in GSE20685 dataset. (C) Survival curve of stage I patients of TCGA cohort. (D) Survival curve of stage I patients of GSE20685 dataset. (E) Survival curve of stage II patients of TCGA cohort. (F) Survival curve of stage II patients of GSE20685 dataset.

