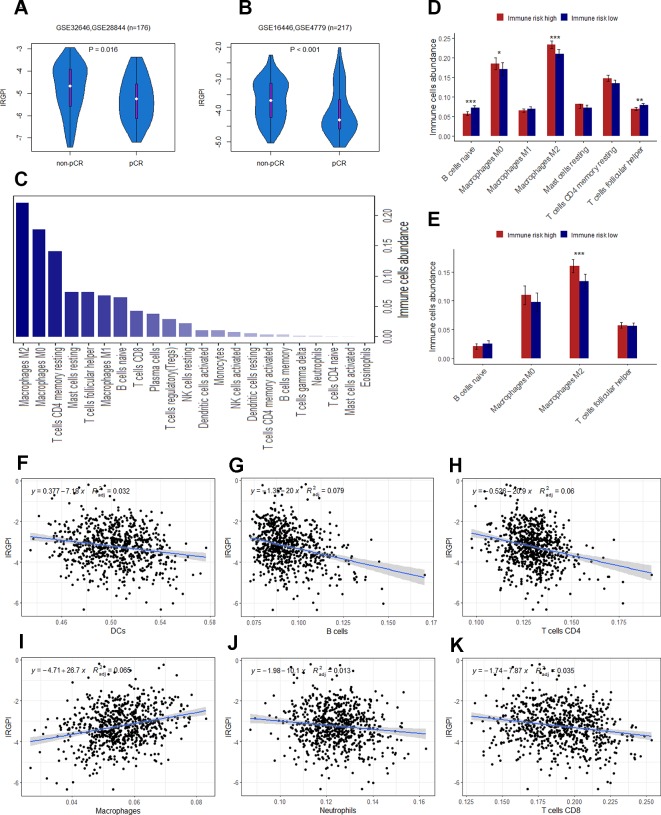
Figure 6.
(A) The difference of IRGPI between pCR and non-pCR groups in GSE32646 and GSE28844. (B) The difference of IRGPI between pCR and non-pCR groups in GSE16446 and GSE4779. (C) 22 types of immune cells abundance calculated by CIBERSORT in TCGA cohort. (D) Immune cells abundance between low and high immune risk groups for TCGA cohort. (E) B cells naïve, Macrophages M2, T cells follicular helper and Macrophages M0 abundance in GSE20685 dataset. The association between adjusted IRGPI and the abundance of DCs (F), B cells (G), T cells CD4 (H), macrophages (I), neutrophils (J), and T cells CD8 (K) calculated by TIMER in TCGA cohort. P values are based on Wilcoxon rank sum test. Error bars indicate estimated 95%CI.

