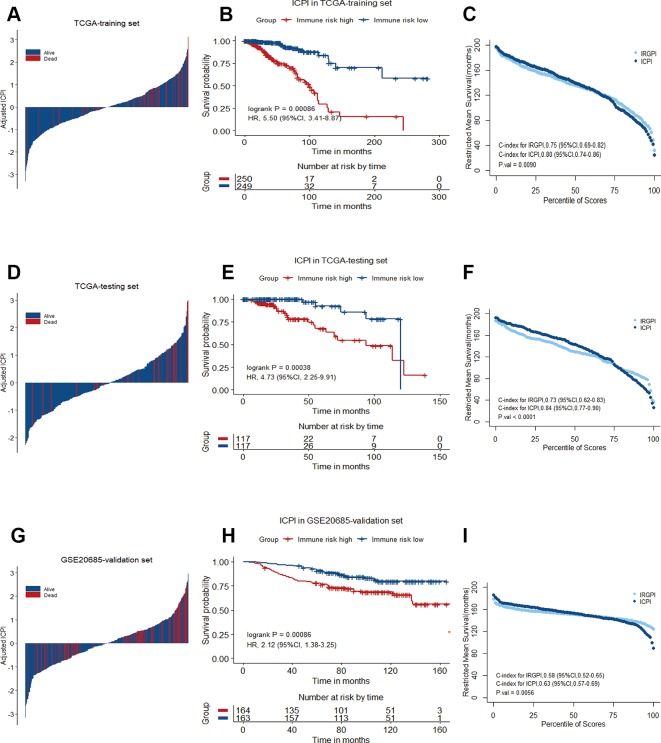
Figure 7.
Immune-clinical prognostic signature characteristics in TCGA training set, TCGA testing set and GSE20685 validation set. (A), (D), and (G) Breast cancer were ranked by immune-clinical risk scores in the TCGA training set, TCGA testing set and GSE20685 validation set. (B), (E), and (H) Kaplan−Meier curves of overall survival (OS) among different ICPI risk groups in TCGA training set, TCGA testing set and GSE20685 validation set. Hazard ratios (HRs) and 95% CIs are for high vs. low immune risk. P values comparing risk groups were calculated with the log-rank test. (C), (F), and (I) Restricted mean survival curves for IRGPI and ICPI scores was plotted on TCGA training set, TCGA testing set and GSE20685 validation set.

