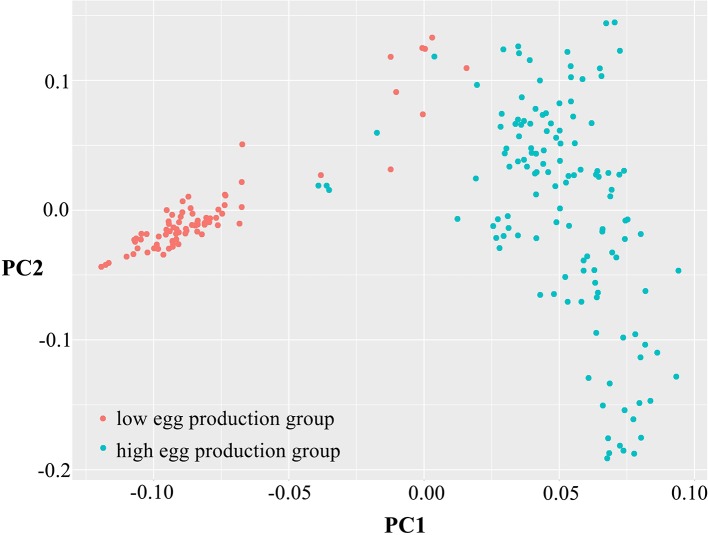
Figure 2.
Principal component analysis of egg production. Principal component 1 (PC1) and principal component 2 (PC2) values comprised the X-axis and the Y-axis and were used to draw the scatter gram, and each dot represents one sample. Red points represent low-yield samples and blue points represent high-yield samples.

