Figure 4.

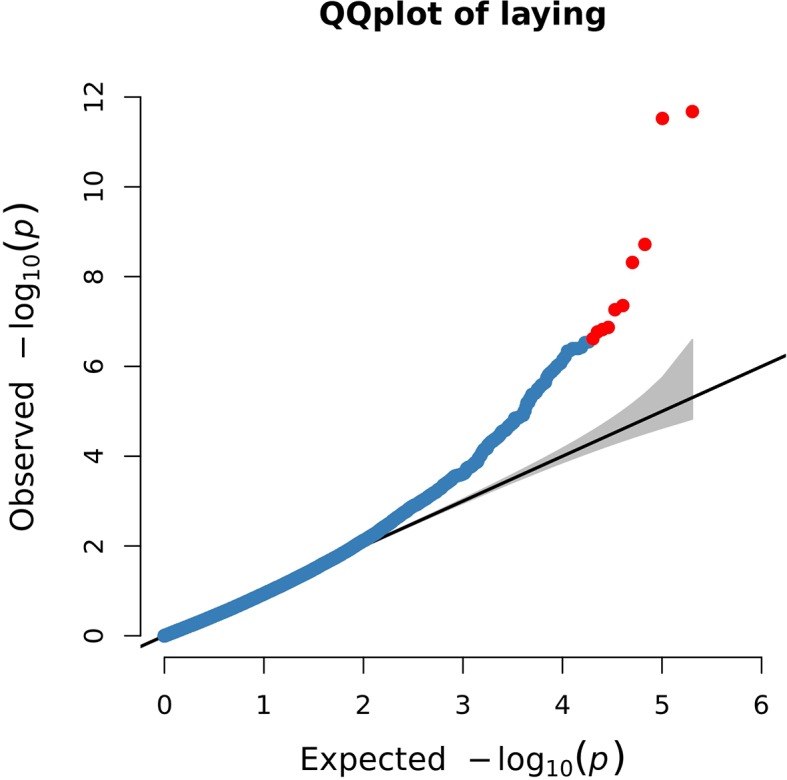
Quantile–quantile (Q-Q) plot of genome-wide association results for egg production. The blue points represent SNPs, and the red points represent the most significant SNPs.

Quantile–quantile (Q-Q) plot of genome-wide association results for egg production. The blue points represent SNPs, and the red points represent the most significant SNPs.