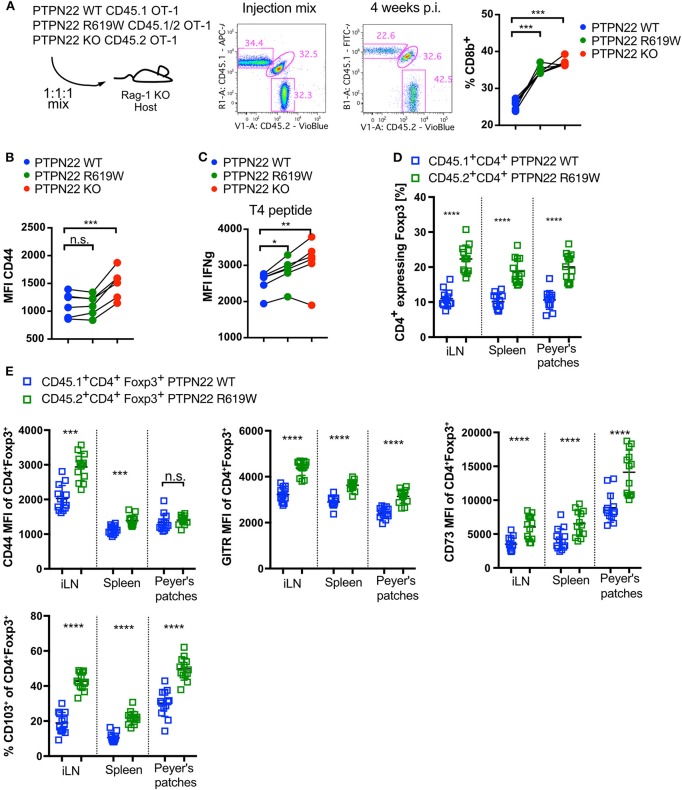
Figure 5.
PTPN22 R619W negatively regulates T cell proliferation in response to lymphopenia. (A) Adoptive transfer of CD45.1 PTPN22 WT, CD45.1/2 PTPN22 R619W and CD45.2 PTPN22 KO CD8 OT-1 cells in a 1:1:1 ratio into lymphopenic Rag-1 KO hosts. Frequency of CD8 T cells from the different genotypes were analyzed 4 weeks after transfer. (B) Analysis of CD44 expression and (C) IFNg expression in response to re-stimulation with T4 peptide 4 weeks post transfer. Data shown in (A–C) is from one representative experiment out of two independent experiments with N = 5 recipient animals, each dot represents one animal. PTPN22 WT, R619W and KO cells were compared by paired one-way ANOVA. (D) CD45.1 PTPN22 WT and CD45.2 PTPN22 R619W bone marrow was mixed 1:1 and transplanted in into fully irradiated CD45.2 PTPN22 R619W recipient mice. The Foxp3+ frequency within PTPN22 WT CD45.1+CD4+ or PTPN22 R169W CD45.2+CD4+ cell pool was assessed 15 weeks post transfer. Each dot represents one animal (N = 13), data is pooled of two independent experiments. A paired t-test was performed to compare PTPN22 WT and R619W cells within the same recipient. (E) Phenotypical analysis of Foxp3+ expressing PTPN22 WT CD45.1+CD4+ and PTPN22 KO CD45.2+CD4+ cells from the experiment outlined in (D). Each dot represents one animal (N = 13), data is pooled of two independent experiments. A paired t-test was performed to compare PTPN22 WT and R619W cells within the same recipient. n.s., non-significant. A p < 0.05 was considered significant *p < 0.05, **p < 0.01, ***p < 0.001, ****p < 0.0001.

