
Figure 4.
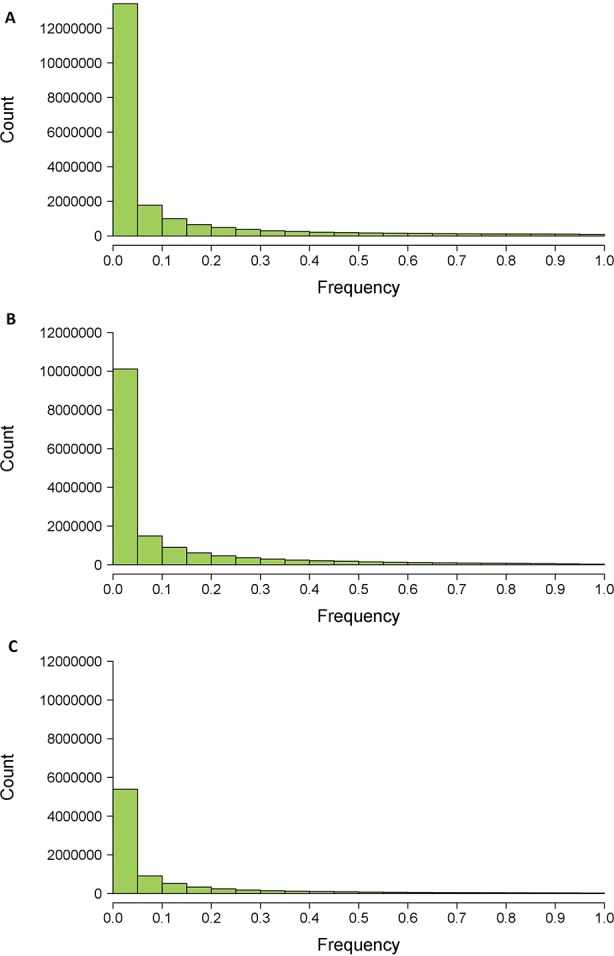
Histograms of variant frequencies after filtering from HaplotypeCaller (A), Platypus (B) and consensus data set (C) between both software.
Official websites use .gov
A
.gov website belongs to an official
government organization in the United States.
Secure .gov websites use HTTPS
A lock (
) or https:// means you've safely
connected to the .gov website. Share sensitive
information only on official, secure websites.
Histograms of variant frequencies after filtering from HaplotypeCaller (A), Platypus (B) and consensus data set (C) between both software.