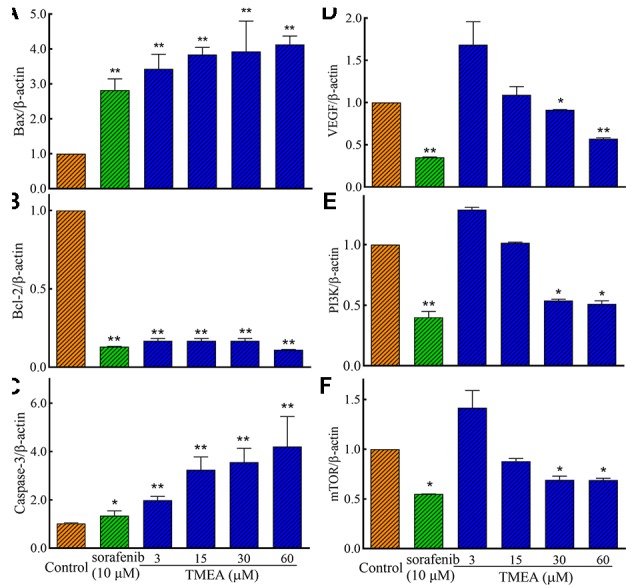
Figure 6.

The relative expression of the related mRNA of Bax (A), Bcl-2 (B), caspase-3 (C), in SW620 cells and VEGF (D), PI3K (E), and mTOR (F) in HUVECs. The cells were treated with various concentrations of TMEA (3, 15, 30, and 60 μM) or sorafenib (10 μM) for 12 h. The data are presented from at least three independent experiments run in triplicate and expressed as mean ± SD. *p < 0.05, **p < 0.01, compared with the vehicle-treated controls by one-way univariate analysis of variance (ANOVA). PI3K, phosphoinositide 3-kinase.
