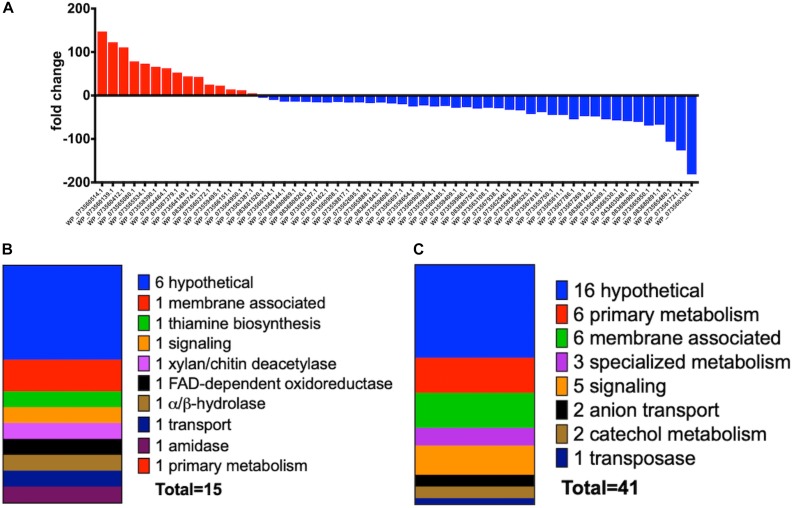
FIGURE 4.
(A) Fold change data observed from A. sp. MeJA exposure experiments with increased transcription indicated with red and positive fold change values and decreased transcription indicated with blue and negative fold change values. Data represented for all genes with ≥ fourfold change (P < 0.05; n = 3 per condition). (B) General categories and classes associated with A. sp. genes with observed ≥ fourfold increases in transcription during MeJA exposure. (C) General categories associated with A. sp. genes with observed ≥ fourfold decreases in transcription during MeJA exposure.

