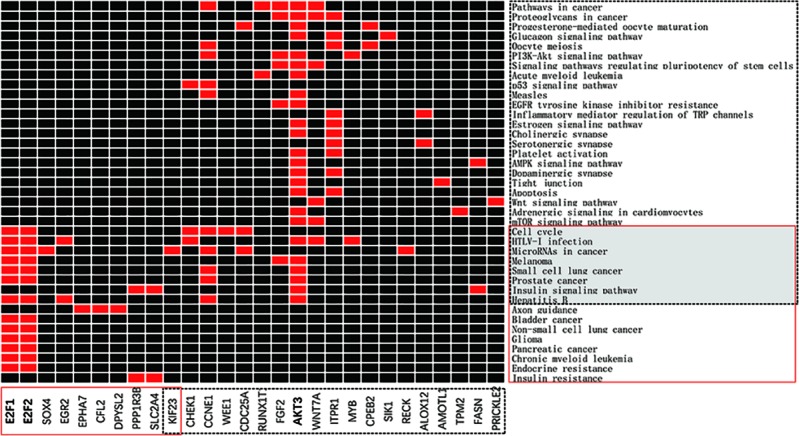
Figure 6.

miRNA-targeted mRNA enrichment pathway. The x-axis represents the genes in the network, in which the red solid line is the target genes of miRNA-93, and the black dotted line is the target genes of miRNA-195. The y-axis represents the KEGG pathway, the red solid box is the enrichment pathway of the miRNA-93 target genes, and the black dotted box is the enrichment pathway of the miRNA-195 target genes.
