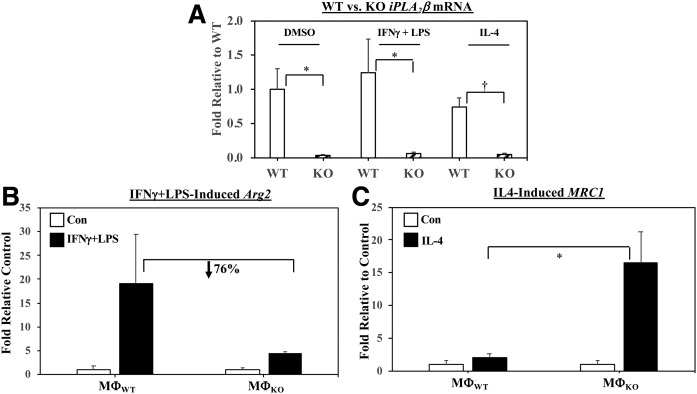
Fig. 5.
Induction of M1 (Arg2) and M2 (MRC1) markers and iPLA2β in MΦWT and MΦKO. Peritoneal macrophages isolated from 8-week-old WT and KO mice were treated with vehicle [control (Con)], IFNγ + LPS, or IL-4. The cells were harvested and processed for real-time qPCR analyses. A: iPLA2β . B: Arg2 (MΦWT and MΦKO Arg2 2−ΔΔCT, 0.095 ± 0.074 and 1.506 ± 0.558.) C: MRC1 (MΦWT and MΦKO MRC1 2−ΔΔCT, 4.273 ± 2.357 and 16.053 ± 10.294). Data are mean ± SEM of fold-change relative to Con determined from four independent experiments. *MΦKO significantly different than MΦWT group, P < 0.05; †MΦKO significantly different than MΦWT group, P < 0.005.

