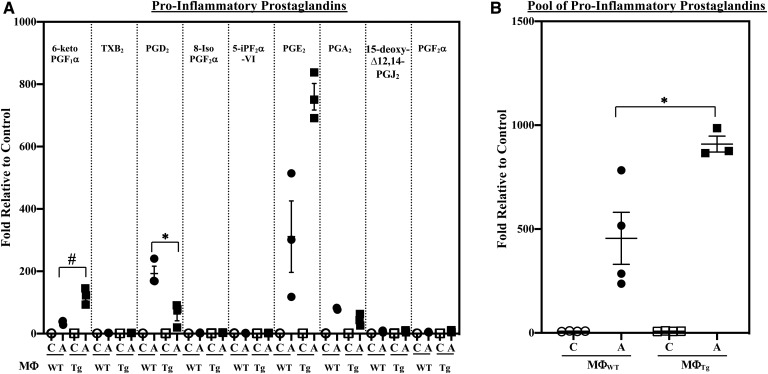
Fig. 7.
Pro-inflammatory PG production by MΦWT and MΦTg. Peritoneal macrophages isolated from 8-week-old WT and Tg mice were treated with vehicle [control (C)] or IFNγ + LPS and the media collected for lipidomics analyses. The data represent activated (A) fold-changes in lipids relative to C. Data are mean ± SEM determined from three to four independent experiments. A: Individual PGs. Control (pmol lipid/1e+06) MΦWT and MΦTg: 6-keto PGF1α, 0.502 ± 0.179 and 0.462 ± 0.069; TXB2, 3.725 ± 0.206 and 4.139 ± 0.152; PGD2, 0.036 ± 0.006 and 0.039 ± 0.008; 8-Iso PGF2α, 0.131 ± 0.006 and 0.103 ± 0.039; 5-IPF2α-VI, 0.200 ± 0.082 and 0.162 ± 0.030; PGE2, 0.147 ± 0.044 and 0.083 ± 0.008; PGA2, 0.177 ± 0.068 and 0.139 ± 0.018; 15-deoxyΔ12,14-PGJ2, 0.028 ± 0.006 and 0.037 ± 0.012; PGF2α, 4.587 ± 0.784 and 3.856 ± 0.448. #MΦTg significantly different from MΦWT, P < 0.01; *MΦTg significantly different from MΦWT, P < 0.05. B: PG pool. Control (pmol lipid/1e+06) MΦWT and MΦTg: 9.533 ± 0.153 and 9.019 ± 0.087. *MΦTg significantly different from MΦWT, P < 0.05.

