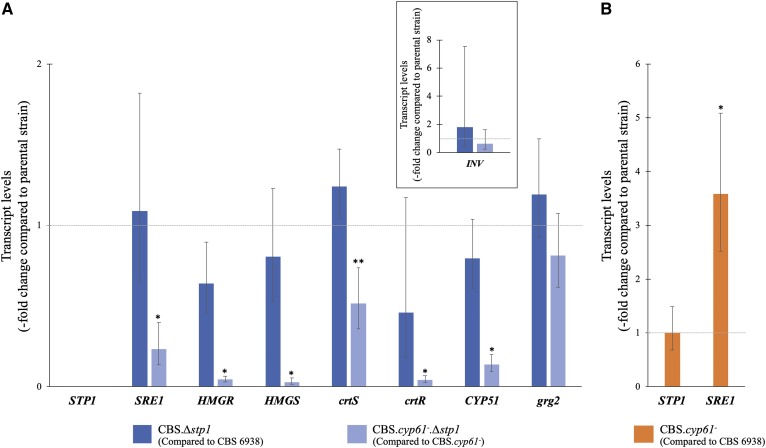
Fig. 5.
Relative expression of selected genes at the transcript level. Relative transcript levels in strain CBS.Δstp1 in relation to those in CBS 6938 (blue) and in strain CBS.cyp61−.Δstp1 in relation to those in CBS.cyp61− (light blue) (A) and in strain CBS.cyp61− compared with those in CBS 6938 (orange) (B). The transcript levels were evaluated by RT-qPCR after 120 h of culture in YM medium with constant agitation. The analyzed genes and GenBank numbers accession were HMGS [MK368600] and HMGR [MK368599] (MVA pathway), CYP51 [KP317478] (ergosterol biosynthesis), crtS [EU713462] (astaxanthin biosynthesis), crtR [EU884133] (ergosterol and astaxanthin biosynthesis), and SRE1 [MK368598] and STP1 [MN380032] (SREBP pathway). The genes grg2 [JN043364.1] and INV [FJ539193.2] (in an enclosed square), which are not likely regulated by Sre1N, were included as controls. Transcript levels were normalized to the housekeeping gene encoding β-actin [X89898.1] and expressed as fold-change compared with the levels in the corresponding parental strain using the 2−ΔΔCt method. Values are the average ± standard deviation of three independent cultures (*P < 0.01, **P < 0.05; Student’s t-test).

