Fig. 5.
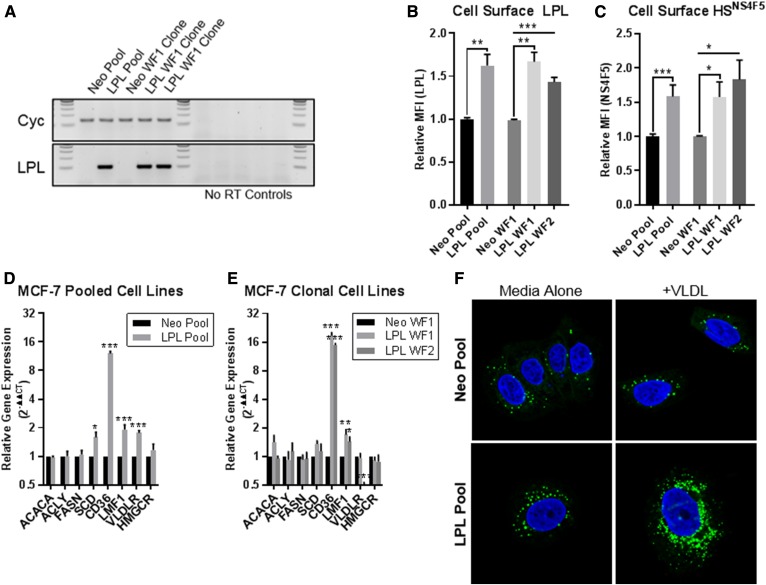
MCF-7 pCMV LPL cell lines overexpress LPL (RNA and protein), display increased cell-surface HSNS4F5, and upregulate mRNA expression of genes involved in FA uptake. A: RT-PCR products visualized on agarose gels. Increased LPL product was observed in MCF-7 pCMV LPL pooled and clonal cell lines compared with the pCMV Neo controls. B: Increased cell-surface staining of LPL in MCF-7 LPL-overexpressing cells quantified by flow cytometry. C: MCF-7 LPL-overexpressing lines display increased cell-surface HSNS4F5. D, E: qRT-PCR of FA metabolism genes; the relative gene expression was calculated using the 2−ΔΔCT method. Data are from ≥3 experiments; mean ± SEM. Statistical significance was determined using two-tailed unpaired t-tests. *P < 0.05, **P < 0.01, and ***P < 0.001. F: MCF-7 pCMV Neo and pCMV LPL cell pools were cultured for 72 h standard media ± VLDL (100 µg/ml). MCF-7 LPL-overexpressing cells exhibited higher LD content both at baseline and with VLDL supplementation. LipidTox (LD stain; green), Hoechst 3342 nuclear stain (blue).

