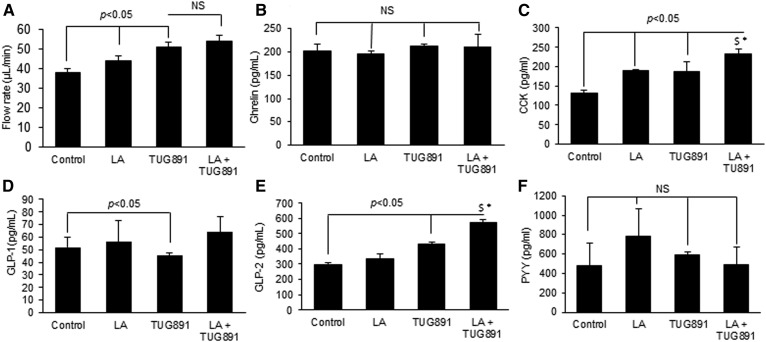
Fig. 5.
Effect of lingual application of TUG891 on the activation of the tongue-brain-gut axis. Experiments were conducted as described in the Materials and Methods section, and the concentrations of different peptides were measured in plasma samples by ELISA kits. A: The histogram expresses the flow rate of hepato-biliary secretions after lingual application of LA or TUG891. The other histograms show plasma concentrations of different hormones: ghrelin (B), CCK (C), GLP-1 (D), GLP-2 (E), and PYY (F). The histograms show the results of independent experiments (n = 3). The difference between values was determined by one-way ANOVA, followed LSD test. P < 0.05 was considered as statistically significant. *In comparison to LA; $In comparison to TUG891.

