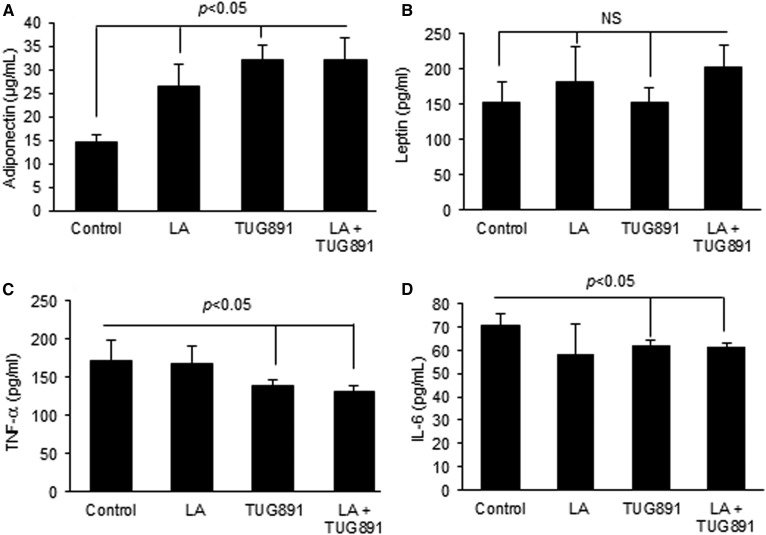
Fig. 6.
Effect of lingual application of TUG891 on adipokines and pro-inflammatory cytokines in mice. Different control and test agents were applied on tongues of anesthetized mice followed by euthanization. The histograms indicate the circulating concentrations of adiponectin (A), leptin (B), TNF-α (C), and IL-6 (D). Analyses were performed by using suitable ELISA kits as described in the Materials and Methods section. The histograms show the results of independent experiments (n = 3). The difference between values was determined by one-way ANOVA, followed by LSD test. P < 0.05 was considered as statistically significant. *In comparison to LA; $In comparison to TUG891.

