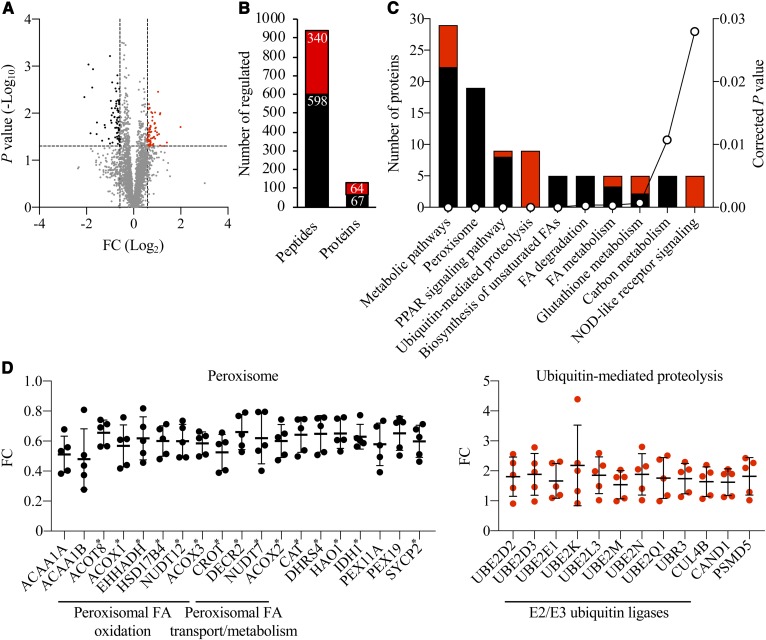
Fig. 2.
Analysis of differentially represented proteins in Stk25−/− versus wild-type livers. A: Volcano plot of differentially represented LD-associated proteins. A ratio of 1.50-fold (vertical dashed lines) and a P value of 0.05 (horizontal dashed line) serve as the threshold for differential expression. B: The total number of differentially expressed unique peptides and proteins. C: Ontology analysis of differentially represented LD-associated proteins. The corrected P value was calculated using a modified Fisher’s exact test by DAVID (DAVID.ncifcrf.gov). D: Relative abundance of individual differentially expressed peroxisomal proteins and components of the ubiquitin-mediated proteolysis pathway. Peroxisomal proteins containing a known or suspected PTS1 sequence (40–43) are indicated by asterisks. A–D: The red and black colors represent peptides/proteins, which were up- or downregulated in abundance, respectively, in Stk25−/− versus wild-type livers. FC, fold change.

