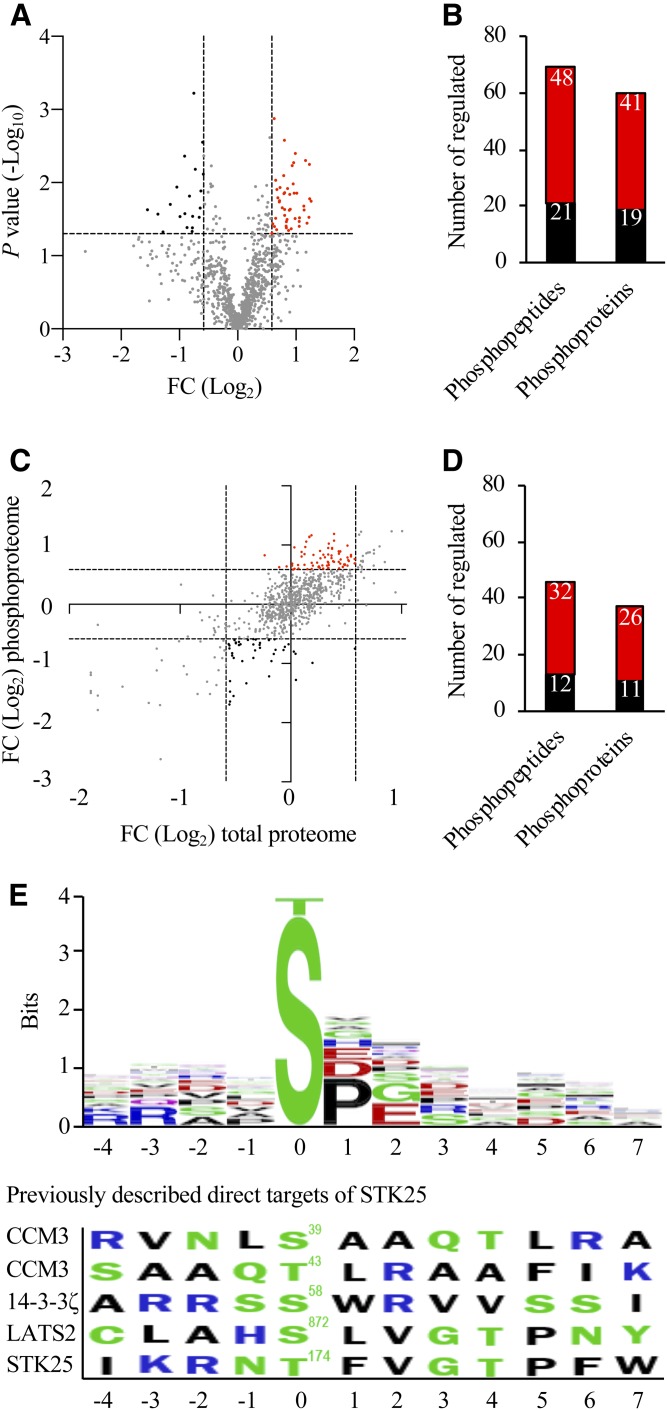
Fig. 3.
Analysis of differentially phosphorylated proteins in Stk25−/− versus wild-type livers. A: Volcano plot of differentially phosphorylated LD-associated proteins. A ratio of 1.50-fold (vertical dashed lines) and a P value of 0.05 (horizontal dashed line) serve as the threshold for differential phosphorylation. B: The total number of differentially phosphorylated unique peptides and proteins. C: To identify changes in phosphopeptide abundance that were not driven by underlying changes in the abundance of corresponding proteins, the following thresholds were applied: change in total protein abundance <1.50-fold; change in phosphosite >1.50-fold (dashed lines). D: The total number of unique peptides and proteins with a significant change in phosphorylation levels but not in the total protein levels. A–D: The red and black colors represent peptides/proteins, which were up- or downregulated at phosphorylation level, respectively, in Stk25−/− versus wild-type livers. E: Consensus sequences were extracted from the peptides with downregulated phosphorylation events in Stk25 knockout livers compared with wild-type livers using the BlockLogo application (34). The residue position in relation to the phosphorylation site is shown on the x-axis and the information content is shown on the y-axis, where the height of the logo element represents its log transformed frequency displayed in bits of information. The colors of the amino acids correspond to their chemical properties; polar amino acids (G, S, T, Y, C, Q, and N) are shown in green, basic amino acids (K, R, and H) are shown in blue, acidic amino acids (D and E) are shown in red, and hydrophobic amino acids (A, V, L, I, P, W, F, and M) are shown in black. The phosphorylation sites of the previously described direct targets of STK25 [Ser39/Thr43 in CCM3, Ser58 in 14-3-3ζ, Ser872 in LATS2, and Thr174 in STK25 (36–38)] are shown for comparison. FC, fold change.

