Figure 6.
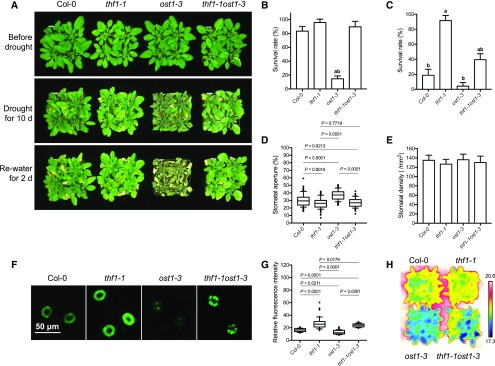
Genetic interaction between thf1 and ost1 mutants. A, Drought resistant assay of thf1-1, ost1-3, thf1-1ost1-3, and Col-0. 21-d-old plants were treated with drought stress for 10 d and then re-watered for 2 d. B and C, The survival rate of thf1-1, ost1-3, thf1-1ost1-3, and Col-0 after 2 d recovery from drought stress treatment for 8 d (B) or 12 d (C). Values are means ± sd (n = 3 replicates, each replicate contained 16 plants per line). The letters a and b above columns indicate significant difference relative to Col-0 and thf1-1 mutant, respectively (P < 0.05, Student’s t test). D, Stomatal aperture in the middle leaves of 21-d-old plants of thf1-1, ost1-3, thf1-1ost1-3, and Col-0 after drought stress treatment for 5 d (n ≥ 80). Stomatal aperture was calculated by the percentage of width/length ratio. E, Stomatal density of the middle leaves of 4-week-old plants of thf1-1, ost1-3, thf1-1ost1-3, and Col-0. F, Representative images of CM-H2DCFDA staining of H2O2 in guard cells of thf1-1, ost1-3, thf1-1ost1-3, and Col-0. G, Quantitative analysis of H2O2 levels in guard cells of thf1-1, ost1-3, thf1-1ost1-3, and Col-0 (n = 90). H, Leaf temperature of 21-d-old plants of thf1-1, ost1-3, thf1-1ost1-3, and Col-0 after drought stress treatment for 5 d.

