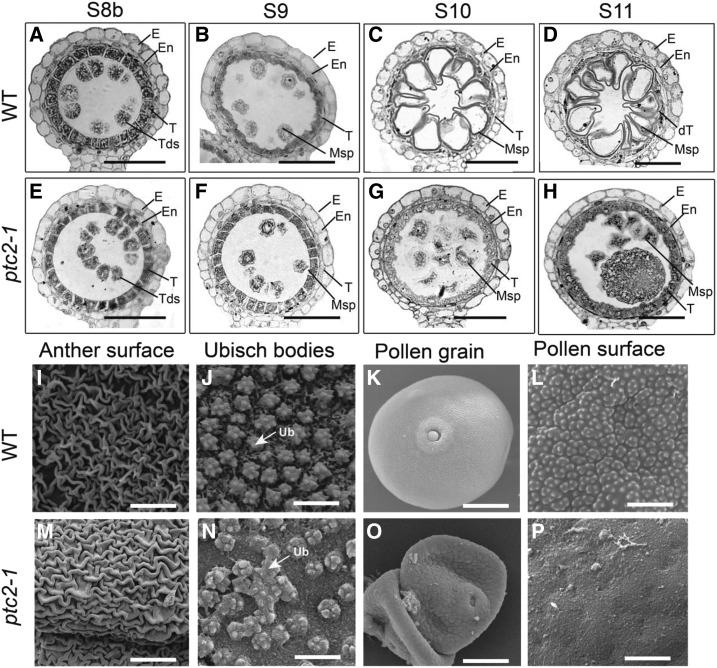
Figure 2.
Comparison of anther development in the wild-type (WT) and ptc2-1 mutant. A to H, Semithin sections of wild-type anthers (A–D) and ptc2-1 anthers (E–H). Stage 8b (A and E); Stage 9 (B and F); Stage 10 (C and G); and Stage 11 (D and H). I to P, SEM analysis of wild-type and the ptc2-1 mutant at stage 13. Anther surface of wild-type (I) and the ptc2-1 mutant (M). Inner surface of the anther walls layers of the wild-type (J) and the ptc2-1 mutant (N), showing Ubisch bodies. Pollen grains of the wild type (K) and ptc2-1 (O). Pollen surface of wild type (L) and the ptc2-1 mutant (P). dT, degraded tapetum; E, Epidermis; En, endothecium; Msp, microspores; Tds, tetrads; T, tapetum; Ub, Ubisch body. Scale bars = 50 µm (A–H), 10 µm (I and M), 2 µm (J and N), 20 μm (K and O), and 3 μm (L and P).

