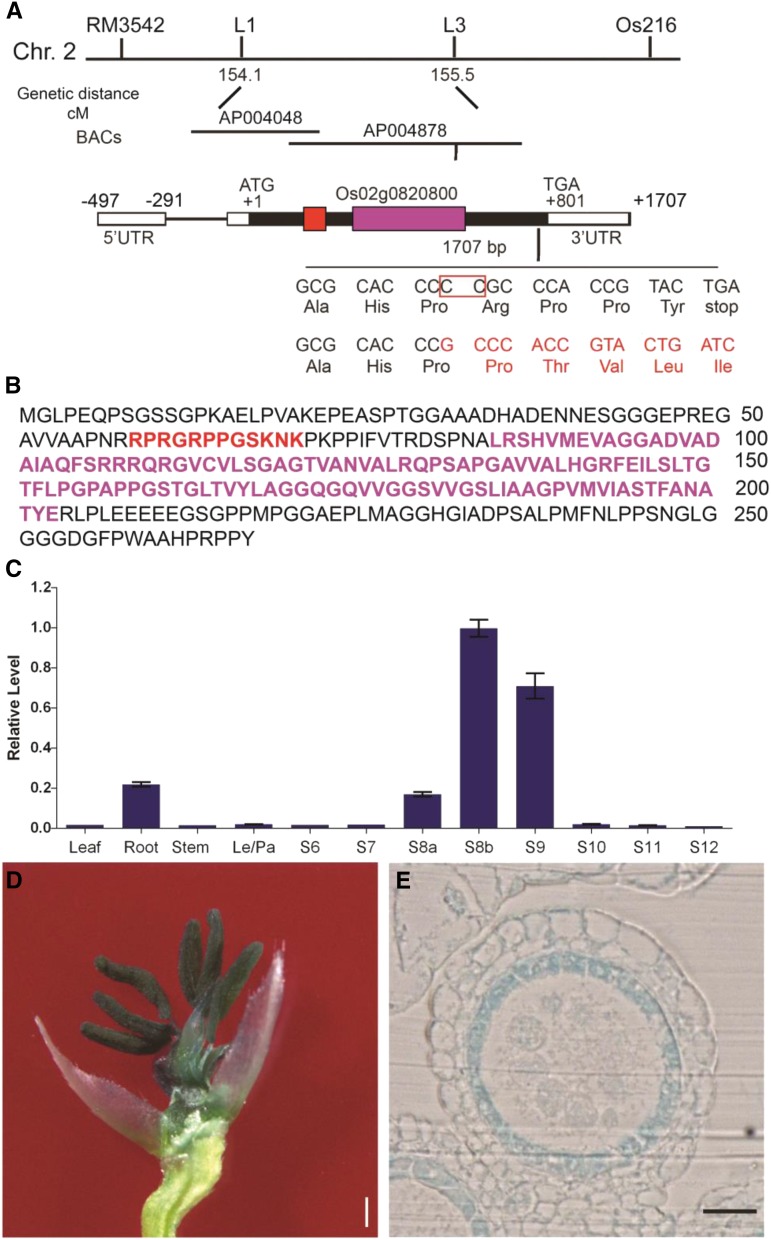
Figure 6.
Map-based cloning and the expression analysis of PTC2. A, Fine mapping of PTC2 on chromosome 2, showing Indel molecular marker positions. Schematic representation of the exon and intron organization of PTC2; the red box represents an AT-hook motif and the purple box represents PPC (DUF296) domain. UTR, untranslated region. B, Protein sequence highlighted with AT-hook motif and PPC (DUF296) domain; the red characters represents an AT-hook motif and the purple characters represents PPC (DUF296) domain. C, PTC2 relative expression in different rice tissues and tapetal developmental stages, analyzed by RT-qPCR. Error bars are ± sd of the three means from three technical repeats in each biological repeat, inferring the se for inferential statistics. D, GUS-stained flower after removal of palea and lemma from PTC2pro:GUS transgenic lines. E, GUS expression driven by PTC2 promoter in tapetum cell layer at early stage 9. Scale bars = 2 mm (D) and 50 μm (E).

