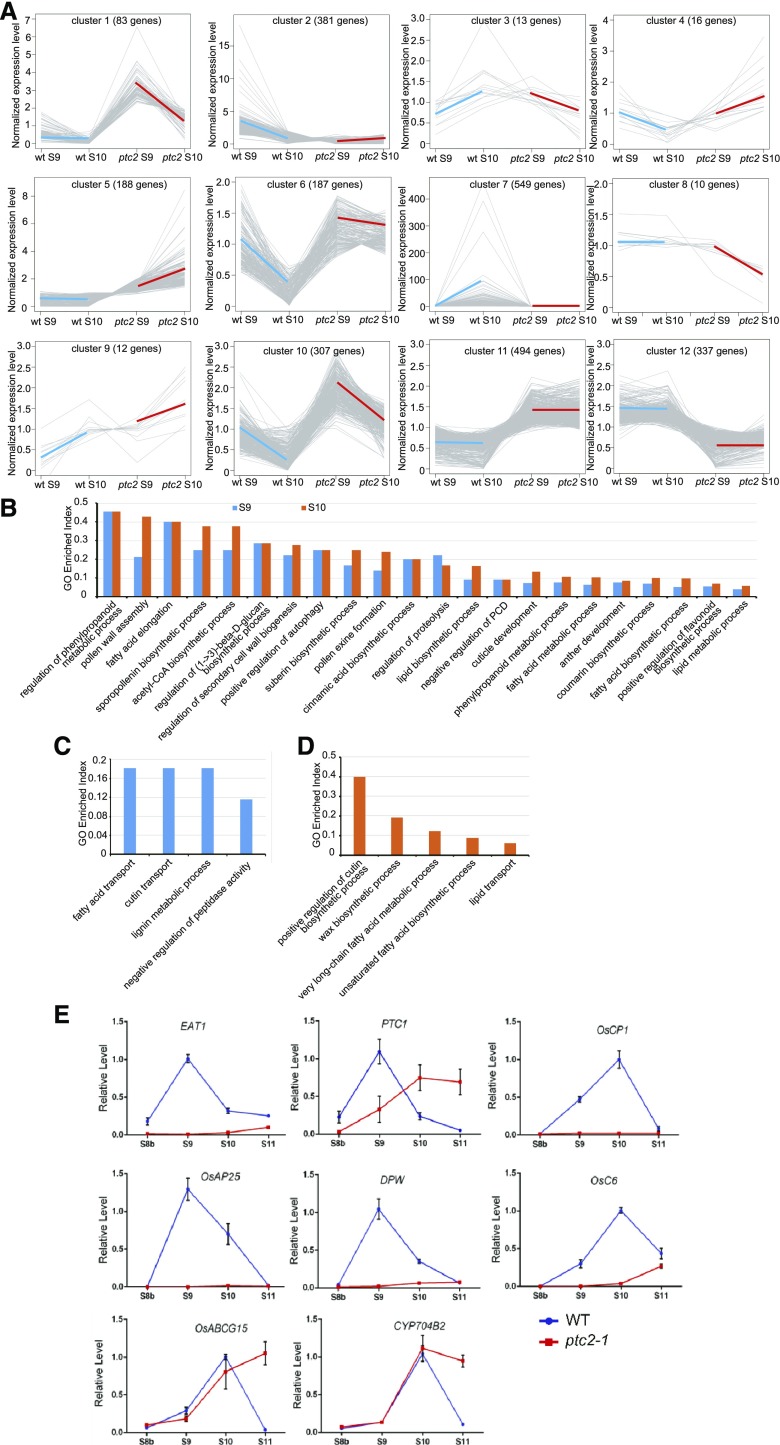
Figure 9.
RNA-seq and RT-qPCR analysis of wild-type (WT) and ptc2 mutant plants. A, Coexpression clustering of genes expressed at stages 9 and 10 in wild-type anthers and ptc2 anthers. B, GEI of DEGs in ptc2 enriched at both stages 9 and 10. C, GEI of DEGs enriched only at stage 9. D, GEI of DEGs enriched only at stage 10. E, RT-qPCR analysis of genes related to sporopollenin metabolism and tapetal PCD in the wild-type and ptc2-1 mutant from stages 8b to 11. Error bars are ± sd of the three means from three technical repeats in each biological repeat, inferring the se for inferential statistics. OsC6, encoding lipid transfer protein; CYP704B2, CYTOCHROME P450 family member

