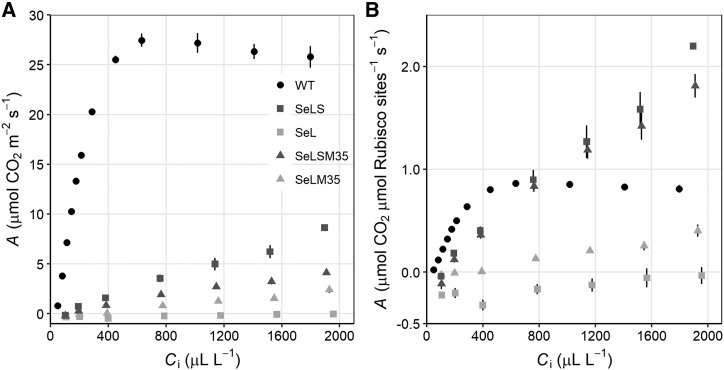
Figure 5.
Response of net CO2 assimilation (A) to intercellular CO2 concentrations (Ci). Rates are expressed on an area basis (A) and on a Rubisco active site basis (B) for leaves of wild-type (WT) tobacco and transplastomic lines expressing β-cyanobacterial carboxysome components from Se: Rubisco LSU (L), Rubisco SSU (S), and CcmM35 (M35). Values represent means ± se (n = 3–4 biological replicates).

