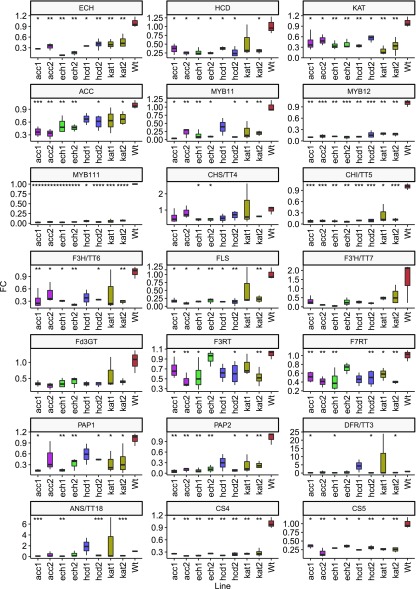
Figure 3.
Transcript levels of candidate genes and characterized flavonoid genes in wild type and mutant lines. Transcript levels were determined by reverse transcription quantitative PCR (RT-qPCR) and normalized to ACT2, UBQ10, and GAPDH3′. Boxplots represent at least three biological replicates, each with two technical replicates. Statistical significance of each line relative to the wild type is coded as ****P ≤ 0.0001, ***P ≤ 0.001, **P ≤ 0.01, and *P ≤ 0.05 by Student's two-tailed t test.

