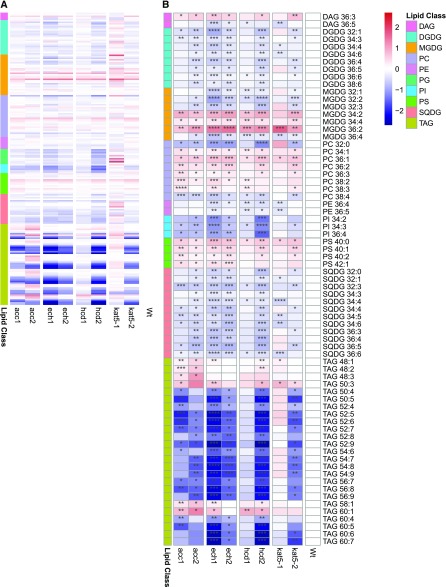
Figure 5.
Lipid profiling of candidate gene mutant lines and wild type. A, Profile of all lipids belonging to the different classes. B, Selected lipids differentially accumulating in mutant lines. Scales represent the log2 fold change relative to the wild type. Statistical significance for each line relative to the wild type is coded as ****P ≤ 0.0001, ***P ≤ 0.001, **P ≤ 0.01, and *P ≤ 0.05 by Student's two-tailed t test. The heatmap was produced using the function pheatmap. DAG, diacylglycerol; PG, phosphatidylglycerol; MGDG, monogalactosyldiacylglycerol, SQDG, sulfoquinovosyldiacylglycerol. The numbers in a lipid name describe the fatty acid chains on the lipid in the format (number of carbons in fatty acid chain):(number of double bonds in fatty acid chain), with unique numbering used to distinguish isomers.

