Figure 6.
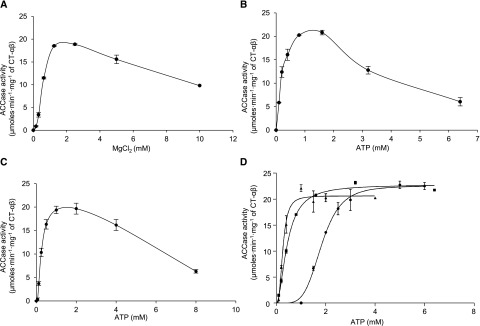
The interdependence of htACCase catalytic activity with ATP and MgCl2. A, The effect of increasing MgCl2 concentration in the presence of 1 mm ATP. B, The effect of increasing ATP concentration in the presence of 1.25 mm of MgCl2. C, The effect of increasing ATP and MgCl2 concentrations while maintaining a constant ratio of [ATP]:[MgCl2] = 1:2.5. D, The effect of increasing ATP and MgCl2 concentrations while maintaining the following relationships: [MgCl2] = [ATP] − 1 mm (●); [MgCl2] = [ATP] (▪), and [MgCl2] = [ATP] + 2.5 mm (▲). htACCase activity was measured as the rate of malonyl-CoA appearance using the MCR-coupled assay. Each data point represents the mean ± se (n = 3), and the experiment was duplicated with analogous results.

