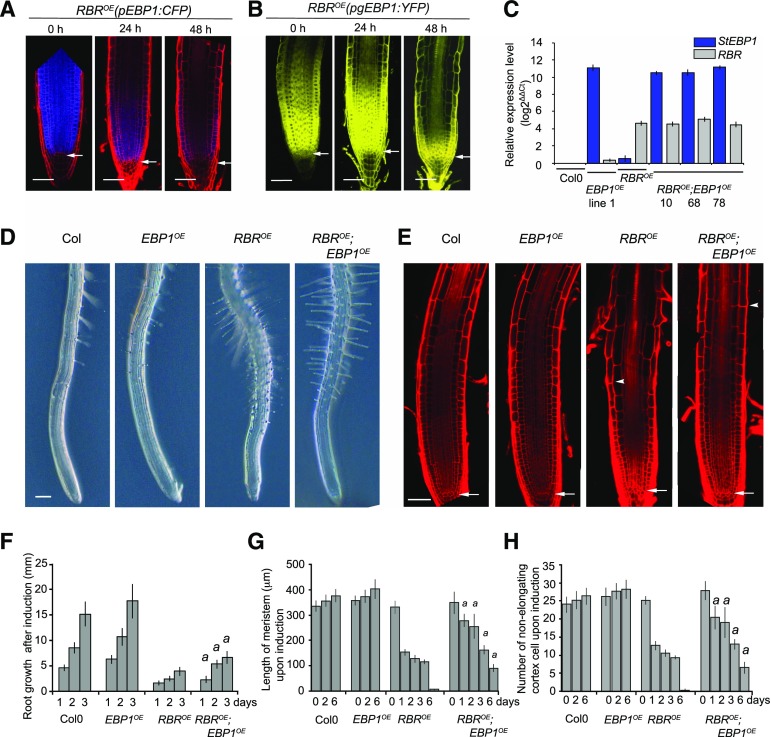
Figure 4.
Elevated level of EBP1 delays differentiation upon induction of RBR expression. A, Confocal microscopy images of the transgenic lines, RBROE(pEBP1:CFP) and RBROE(pgEBP1:YFP). B, Upon induction of RBR with dexamethasone (dex) treatment (1 μm), at the given time points. Note, the loss of meristem structure and progressive differentiation due to RBR induction and the concomitant drop in EBP1 transcription and reduction of EBP1-YFP abundance. C, To generate the RBROE;EBP1OE lines, the transgenic lines RBROE (Wildwater et al., 2005) and EBP1OE (line 1; Horváth et al., 2006) constitutively overexpressing the Solanum tuberosum EBP1 (StEBP1) were introgressed. The expression levels for RBR and EBP1 were analyzed by quantitative reverse transcription-PCR in three independent introgressed lines (RBROE;EBP1OE line 10, 68, 78; F3 generation) using RBR- and StEBP1-specific primers. As a control, the parental lines (RBROE and EBP1OE) and Col0 were tested. For the introgressed line 10, the transgenic line EBP1OE line 1 was used as a parent, while for the lines 68 and 78, EBP1OE line 2. D, Representative root samples of Col0, EBP1OE, RBROE and RBROE;EBP1OE lines upon 24 h dex (1 μm) induction. See also Supplemental Figure S5A. E, Confocal images of propidium iodide–stained root samples from Col0, EBP1OE, RBROE and RBROE;EBP1OE lines upon 72 h dex (1 μm) treatment. In (D) and (E), the arrowhead shows the position of the first differentiating epidermal cell, while in (E) the arrow points to the QC. Scale bars =1 mm (D) and 50 μm (E). F, Root growth (millimeters) after 24, 48, and 72 h dex (1 μm) treatment. Induction with dex started on 6-d-old seedlings. G, Meristem length and number of non-elongating cortical cells (H) of Col0, EBP1OE, RBROE and RBROE;EBP1OE lines after 0, 24, 48, 72, and 144 h dex (1 μm) induction. The region of the transit amplifying cells in the RBROE root meristem is fully differentiated around 96 h dex treatment; n > 3, n > 15 seedlings at each repeat for each genotype. In (F), (G), and (H), values represent means with StDv. a: P-value < 0.01 shows the significance of the measured values of RBROE;EBP1OE line compared with RBROE at the given time point.

