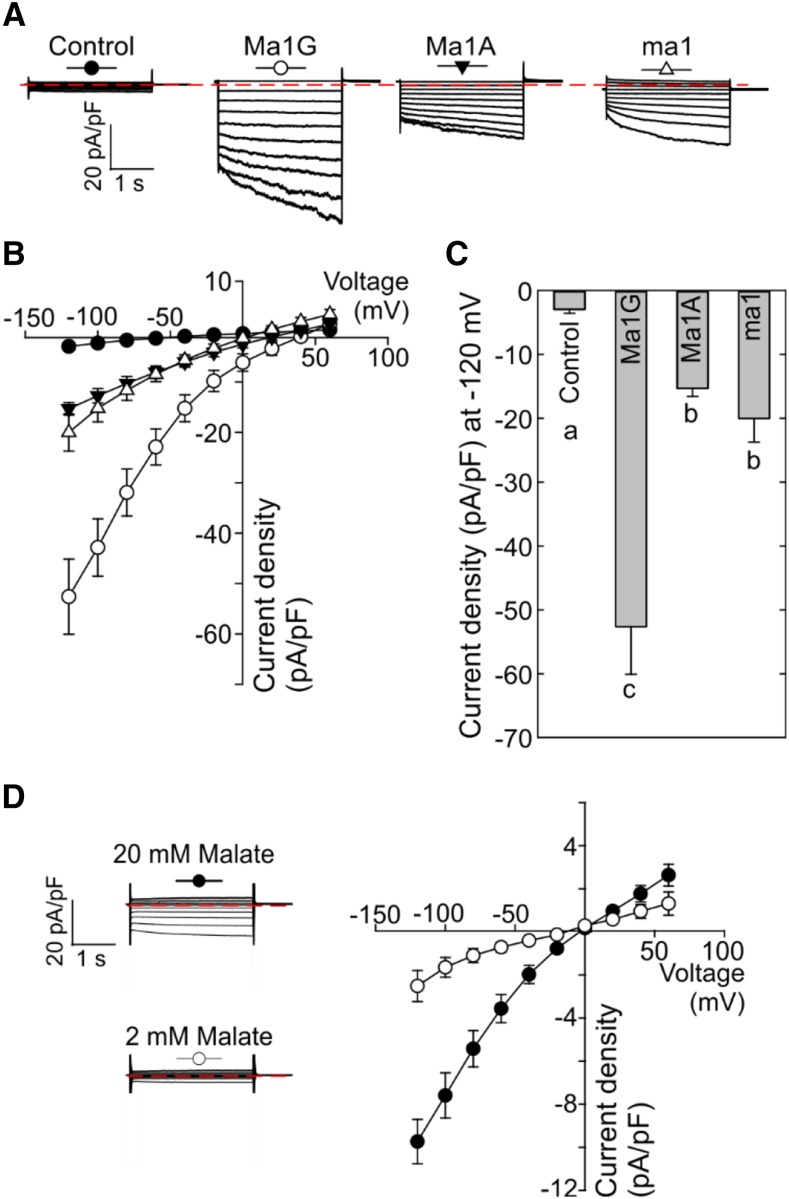
Figure 3.
Patch-clamp analysis of malate transport activity of Ma1G, Ma1A, and ma1 expressed in N. benthamiana. A, Representative recordings of whole-vacuole currents in control vacuoles (expressing empty vector) and vacuoles from cells expressing Ma1G, Ma1A, or ma1. Currents across the tonoplast were evoked in response to 3-s voltage pulses ranging from +60 to −120 mV in 20-mV steps. The zero-current level is indicated by the red dotted line. B, Mean current-voltage relationships from whole-vacuole currents constructed from steady-state current recordings as those shown in A for control vacuoles (n = 12) and vacuoles from cells expressing Ma1G (n = 10), Ma1A (n = 9), or ma1 (n = 10). The symbol for each curve corresponds to that depicted at the top of each set of traces in A. Data are means ± se. C, Bar graphs representing the current densities at −120 mV obtained by the patch clamping of control vacuoles and vacuoles from cells expressing Ma1G, Ma1A, or ma1. Different letters (a, b, and c) indicate significant differences between groups using Tukey’s honestly significant difference (HSD) test at P < 0.05 after ANOVA. Error bars denote se. D, The Ma1G-mediated current is dependent on the cytosolic malate concentration. Representative recordings of whole-vacuole currents from cells expressing Ma1G as the malate concentration in the bath solution (i.e. cytosolic) was decreased from 100 mm (top) to 20 or 2 mm. Currents were evoked using the same protocol described in A. Note that the time and current scales are identical to those shown in A.

