Figure 3.
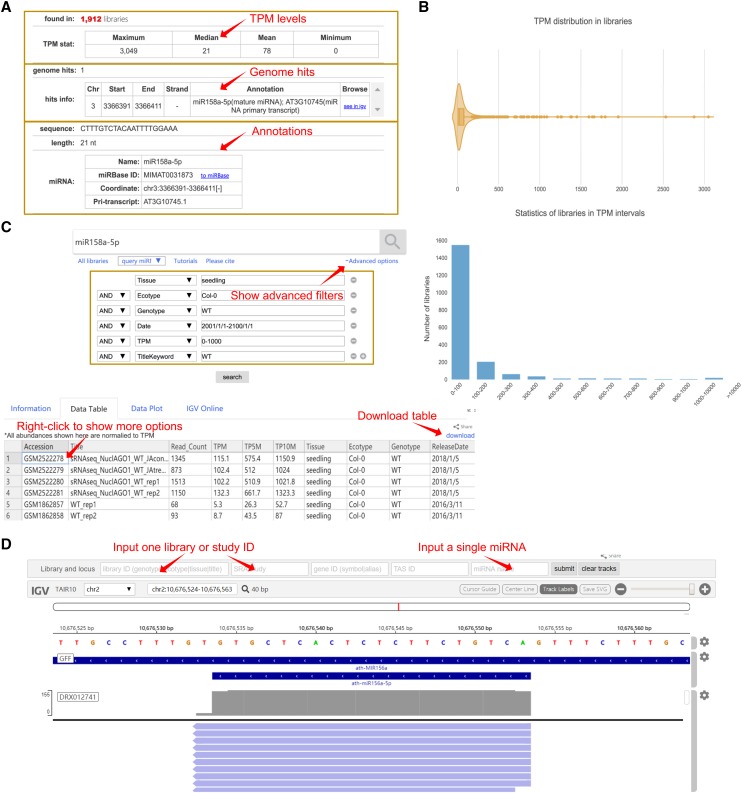
Example of a query using miR158a-5p. A, Example data for miR158a-5p, such as the statistics of maximum, median, mean, and minimum TPM levels in all libraries, as well as genome hits and their annotations on miRBase. B, The violin plot shows the overall TPM distribution, and each point represents the TPM level of miR158a-5p in a library. The bar diagram displays the number of libraries in different TPM intervals. C, The result table displays the read count, TPM, TP5M, and TP10M levels of miR158a-5p in all libraries. The advanced options can be used to filter the results by tissue, ecotype, genotype, release date, TPM level, or keyword. Right-clicking on each column of this table shows more operations, such as adding, removing, or sorting a column, linking a library to the National Center for Biotechnology Information, or adding a library to online IGV. D, The online IGV browses the mapped miR158a-5p sequences in the DRX012741 library.

