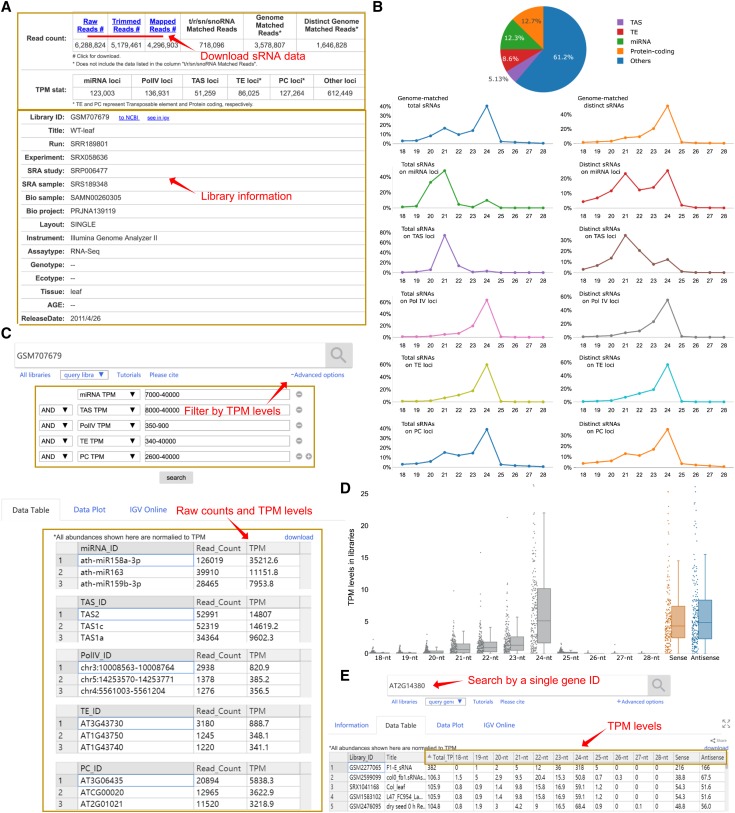
Figure 4.
Examples of queries using library ID and gene ID. A to C, Search by library ID. A, The library information includes statistics of the raw, trimmed, mapped, t/r/sn/snoRNA-matched, genome-matched total and distinct reads, and the TPM levels of sRNAs generated from miRNA, TAS, Pol IV, TE, PC, and other classes of loci. B, The pie diagram exhibits the percentage of each class of sRNAs in the library, and the line diagrams show the size distributions of genome-matched total and distinct sRNAs from each class, with x axis indicating sRNA size (nt), and y axis showing the percentage of sRNAs. C, The tables display the read counts and TPM levels of sRNAs derived from each of miRNAs, TAS, Pol IV, TE, and the Top-100 abundant PCs. The advanced options additionally allow the users to filter the results by the TPM levels of sRNAs produced from different classes of loci. d and E, Search by gene ID. D, The diagram with scatters and boxes describes the TPM levels of sRNAs on the queried locus across all libraries. The gray, orange, and blue colors represent 18–28-nt sRNAs, sense, and antisense sRNAs, respectively. E, The table shows the TPM levels of 18–28-nt, sense, and antisense sRNAs generated from that locus in each library.

