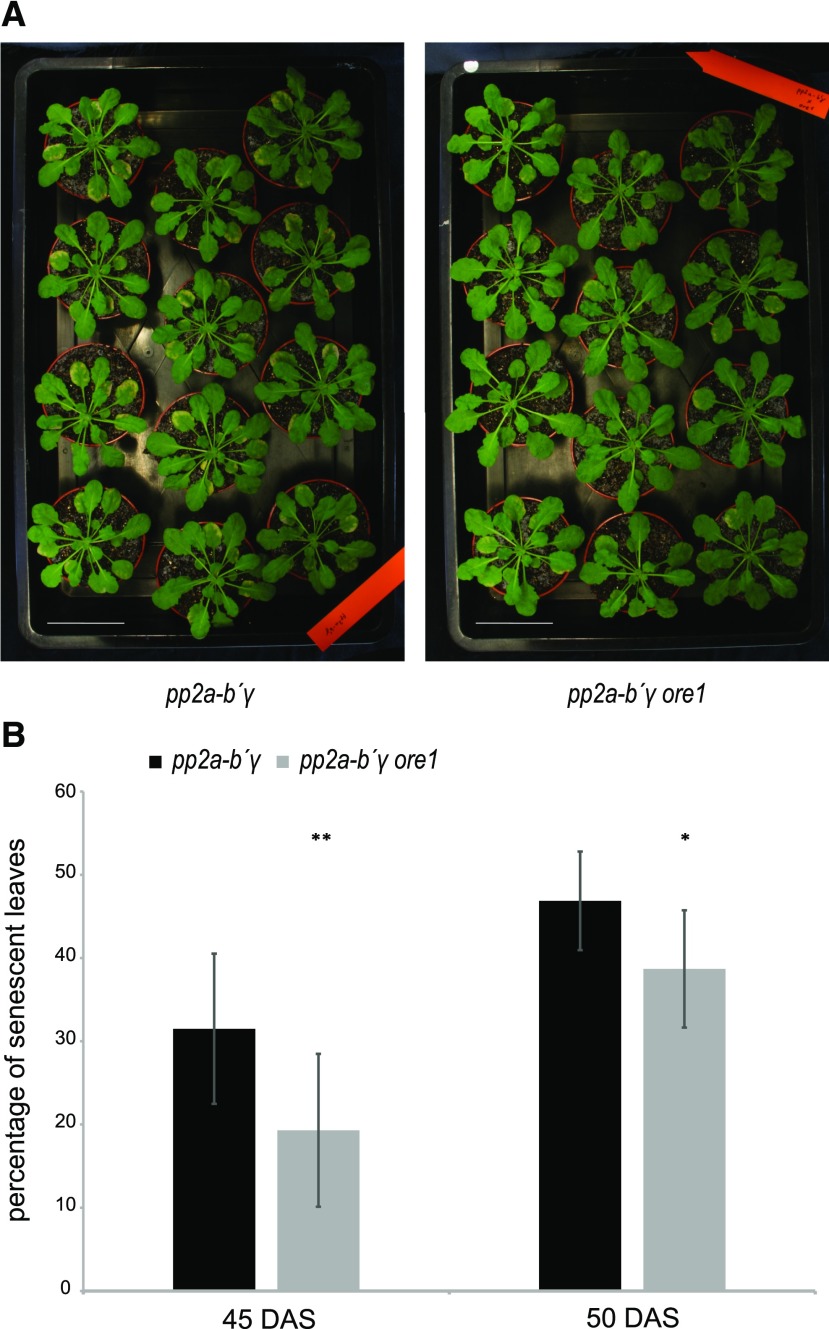
Figure 6.
Senescence progression in pp2a-b′γ and pp2a-b′γ ore1 leaves. A, Photographs depicting leaf yellowing in pp2ab′γ and pp2ab′γ ore1 leaves, 45 DAS. Scale bars = 5 cm. B, Quantification of senescence progression in pp2ab′γ and pp2ab′γ ore1 leaves shown in (A), expressed as percentage of the number of leaves showing any visual symptoms of yellowing and cell death from all leaves of the plant. Data are means (nplants = 12) ± sd. Statistically significant differences to pp2ab′γ are indicated by asterisks. Student’s t test, **P < 0.005; *P < 0.01.

