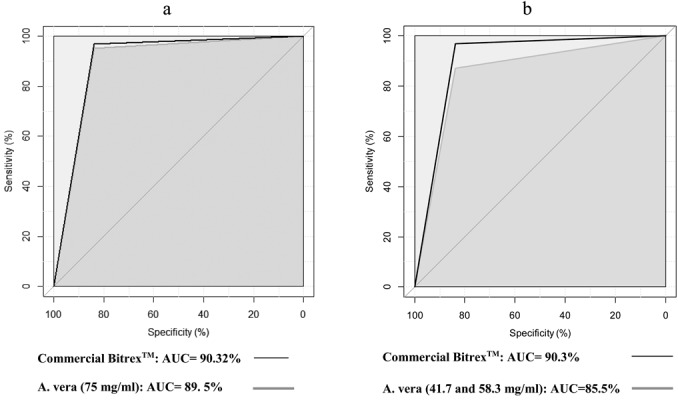
Fig. 3.

Comparison of area under the ROC curves (AUC) for threshold solutions: BitrexTM and A. vera; 75 mg/ml (a), 41.7, 58.3, and 75 mg/ml (b).

Comparison of area under the ROC curves (AUC) for threshold solutions: BitrexTM and A. vera; 75 mg/ml (a), 41.7, 58.3, and 75 mg/ml (b).