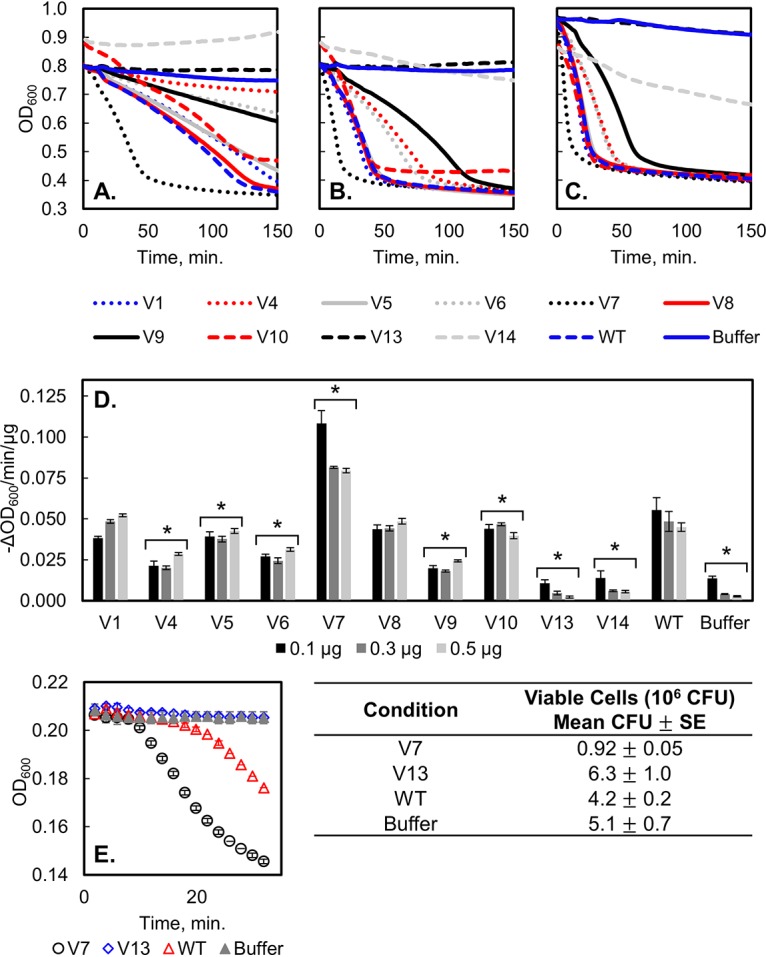
FIG 10.

LysEFm5 variant and WT activity against VRE. Turbidity reduction assay results where (A) 0.1 μg (n = 4 for variants, 8 for the WT), (B) 0.3 μg (n = 4 for variants, 8 for the WT), or (C) 0.5 μg (n = 8 for variants, 16 for the WT) of each lysin was combined with VRE cell wall fragments in 200 μl of PBS (total). Additionally, a buffer negative control was included where no lysin was added (n = 32). OD600 was monitored over time, with data collected every 2 min. Error bars are not shown for visual clarity; a measure of the uncertainty between replicates is given in Fig. 10D as the standard deviations in the slope of the linear regions. (D) Quantified activity for variants, WT, and the buffer negative control. The maximum change in OD600 over a 10-min period was calculated from the turbidity assay results for each replicate. *, P < 0.004 (compared to the WT) for a two-tailed, two-sample heteroscedastic Student's t test with a Bonferroni’s correction applied (n = 12). The activity of variants 13 and 14 was additionally statistically insignificant from that of the buffer negative control (P = 0.54 and P = 0.009, respectively). (E) Bacteriolytic activity of variants 7 and 13, the WT, and buffer against live 8-E9 VRE; 0.5 μg of lysin was applied to mid-exponential phase Enterococcus faecium 8-E9 resuspended in PBS. Cell lysis was monitored dynamically via OD600 reduction (left). Killing activity was assessed by plating serially diluted cell suspensions after approximately 30 min (right). Data are presented as means ± standard errors.
