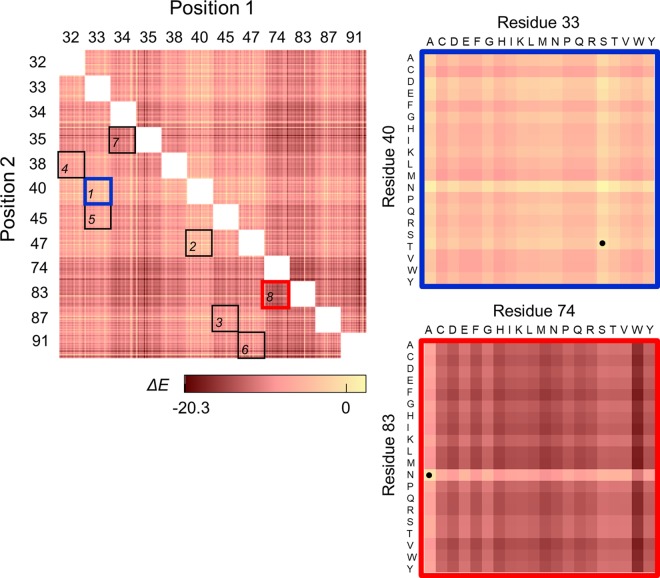
FIG 3.
The predicted changes in statistical fitness for double mutants. The change in statistical fitness compared to that of the WT, ΔE, for all double mutants with diversity at positions 32, 33, 34, 35, 38, 40, 45, 47, 74, 83, 87, and/or 91 was computed using PLMC with inputs from MSA group Firmicutesstringent-2k (Table 1). (Left) The eight libraries chosen for creation are boxed. (Right) A closer look at the predicted ΔE values for libraries 1 (the library with the highest average ΔE value, −4 ± 2) and 8 (the library with the lowest average ΔE value, −12 ± 3). The dotted squares represent WT residues.

