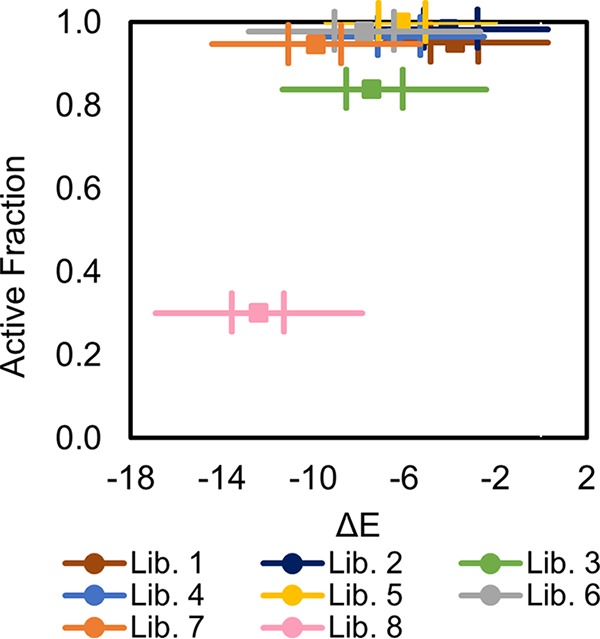
FIG 6.

Active fraction of variants in library as a function of average ΔE. The difference between the statistical fitness of each variant (using MSA group Firmicutesstringent-2k) and the WT, ΔE, is plotted against the active fraction of classified mutants in a library. The central square is the median ΔE value and the left- and rightmost vertical lines represent the 25th (Q1) and 75th (Q3) percentiles. Whiskers extend to the most extreme points not considered outliers; outliers are defined as values less than Q1 − WM(Q3 − Q1) or greater than Q3 + WM(Q3 − Q1), where WM is the maximum whisker length.
