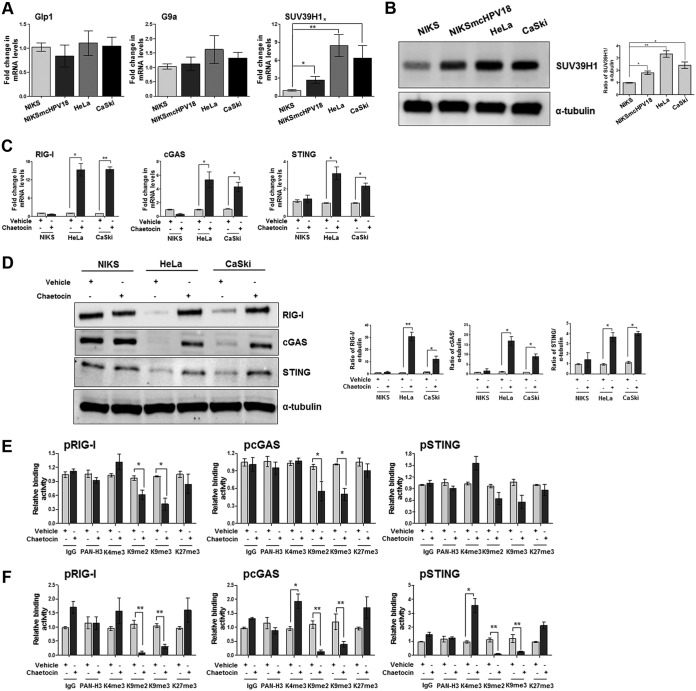
FIG 1.
Pharmacological inhibition of the H3K9-specific histone methyltransferase SUV39H1 decreases heterochromatin in hrHPV-transformed cells. (A) Transcript levels of the indicated genes were assessed by qPCR, and values were normalized to those for GAPDH, with the NIKS value set to 1. Data are presented as mean values from biological triplicates. Error bars indicate SD. *, P < 0.05; **, P < 0.01 (unpaired t test). (B) NIKS, NIKSmcHPV18, HeLa, and CaSki total cell extracts were subjected to immunoblot analysis with anti-SUV39H1 and anti-tubulin antibodies. The densitometry values of SUV39H1 were normalized to those of tubulin. Values are representative of three independent experiments. Error bars indicate SD. *, P < 0.05; **, P < 0.01 (unpaired t test). (C) NIKS, HeLa, and CaSki cells were treated with chaetocin (150 nM) or vehicle (dimethyl sulfoxide [DMSO]). After 24 h, transcript levels of the indicated genes were assessed by qPCR, and the values were normalized to those for GAPDH, with each vehicle-treated value set to 1. Data are presented as mean values from biological triplicates. Error bars indicate SD. *, P< 0.05; **, P< 0.01 (unpaired t test). (D) NIKS, HeLa, and CaSki cells were treated with chaetocin (150 nM) or vehicle (DMSO). After 24 h, total cell extracts were subjected to immunoblot analysis with anti-RIG-I, cGAS, STING, and anti-tubulin antibodies. The intensities of the bands for each antibody were quantified by densitometry, and ratios of the abundance of these proteins relative to that of tubulin were calculated. Values are representative of three independent experiments. Error bars indicate SD. *, P < 0.05; **, P < 0.01 (unpaired t test). (E and F) Extracts were prepared from HeLa (E) or CaSki cells (F) treated for 24 h with chaetocin (150 nM) or vehicle (DMSO). ChIP assay was carried out using antibodies specific for unmodified histone H3 (PAN-H3), trimethylated lysine 4 of H3 (H3K4me3), dimethylated lysine 9 of H3 (H3K9me2), trimethylated lysine 9 of H3 (H3K9me3), trimethylated lysine 27 of H3 (H3K27me3), or IgG as a control. Immunoprecipitated promoter sequences were measured by qPCR, and CT values for the samples were equated to input CT values. Values are represented as relative binding activity from three independent experiments. Error bars indicate SD. *, P < 0.05; **, P < 0.01 (unpaired t test).

