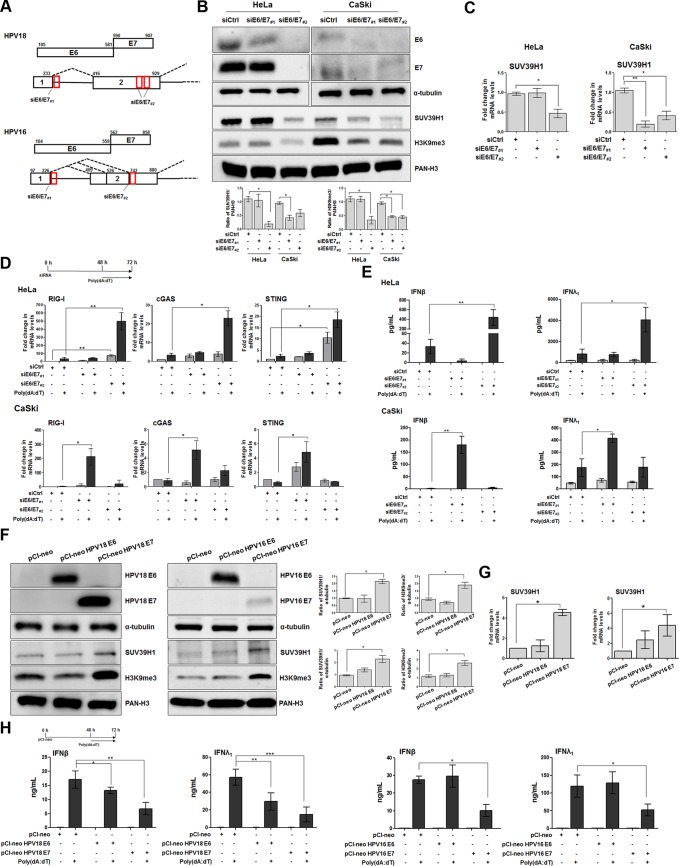
FIG 3.
HPV E7 oncoprotein regulates SUV39H1 expression levels. (A) Diagrams of HPV16 and HPV18 E6 and E7 open read frames (ORFs; boxes with E6 and E7 labels) and bicistronic pre-mRNA transcripts with exons (boxes) and introns (lines between boxes). Numbers above the ORFs and bicistronic transcripts are nucleotide positions in each viral genome. Red boxes indicate siRNA oligonucleotide target sites. (B) Total extracts from HeLa or CaSki cells transfected with siE6/E7#1, siE6/E7#2, or siCtrl for 72 h were subjected to immunoblot analysis with anti-E6, anti-E7, or anti-tubulin, and acid extracts from the same set of samples were probed with anti-SUV39H1, anti-H3K9me3, or anti-PAN-H3. Densitometry values of protein bands were normalized to those of PAN-H3 (acid extracts) or tubulin (total extracts). Values are representative of three independent experiments. Error bars indicate SD. *, P < 0.05 (unpaired t test). (C) Transcript levels of SUV39H1 were assessed by qPCR in the cells described in panel B. Values were normalized to those of GAPDH, with siCtrl value set to 1. Data are presented as mean values from biological triplicates. Error bars indicate SD. *, P < 0.05; **, P < 0.01 (unpaired t test). (D) Transcript levels of the indicated genes were assessed by qPCR in HeLa (upper) or CaSki (lower) cells transfected with siE6/E7#1, siE6/E7#2, or siCtrl for 48 h and then mock transfected or transfected with poly(dA·dT) for 24 h. Values were normalized to those of GAPDH, with siCtrl-mock-transfected cells value set to 1. Values are representative of three independent experiments. Error bars indicate SD. *, P < 0.05; **, P < 0.01 (unpaired t test). (E) ELISA quantification of IFN-β and IFN-λ1 protein in supernatants from the cells described in panel B, mock transfected or transfected with poly(dA·dT) for 24 h. Data are presented as mean values from biological triplicates. Error bars indicate SD. *, P < 0.05; **, P < 0.01 (unpaired t test). (F) Total or acid extracts from HEK293 cells transfected with pCI-neo, pCI-neo HPV18 E6, pCI-neo HPV18 E7, pCI-neo HPV16 E6, or pCI-neo HPV16 E7 for 72 h were subjected to immunoblot analysis with anti-E6, anti-E7, or anti-tubulin antibodies (all total extracts), while anti-SUV39H1, anti-H3K9me3, or anti-PAN-H3 were used for acid extracts. Densitometry values of protein bands were normalized to those of PAN-H3 (acid extracts) or tubulin (total extracts). Values are representative of three independent experiments. Error bars indicate SD. *, P < 0.05 (unpaired t test). (G) Transcript levels of SUV39H1 were assessed by qPCR in HEK293 cells transfected with pCI-neo, pCI-neo HPV18 E6, pCI-neo HPV18 E7, pCI-neo HPV16 E6, or pCI-neo HPV16 E7 for 72 h. Values were normalized to those of GAPDH, with the pCI-neo-transfected value set to 1. Data are presented as mean values from biological triplicates. Error bars indicate SD. *, P < 0.05 (unpaired t test). (H) ELISA quantification of IFN-β and IFN-λ1 protein in supernatants from the cells described in panels F and G, mock transfected or transfected with poly(dA·dT) for 24 h. Data are presented as mean values from biological triplicates. Error bars indicate SD. *, P < 0.05; **, P < 0.01; ***, P < 0.001 (unpaired t test).

