
FIG 2.
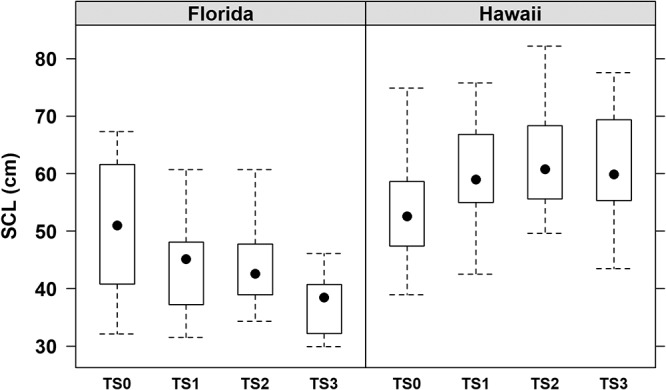
Hawaiian turtles were uniformly larger than Floridian turtles. Box plots of the straight carapace length (SCL) for green turtles from Florida and Hawaii partitioned by tumor score (TS) categories, ranging from nontumored (TS0) to severely tumored (TS3). The boxes represent the 25th and 75th percentiles, whiskers are 1.5 times the interquartile range, and the black dots are the medians.