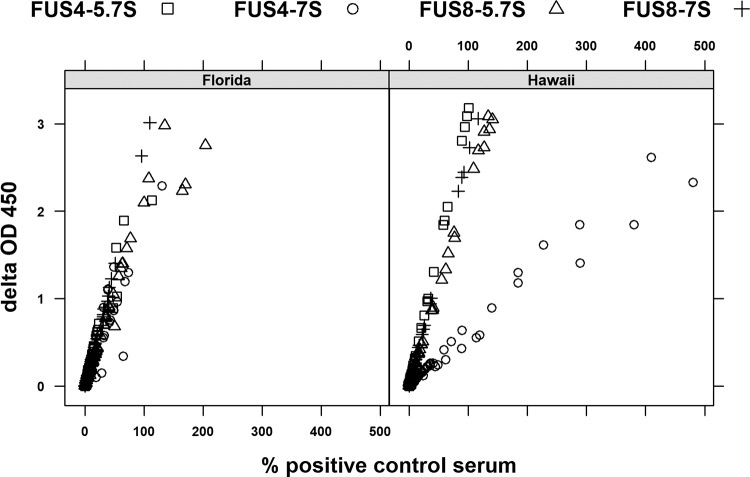
FIG 4.
Delta OD and the percentage of the value for the positive control correlate. Scatter plot ELISA results are expressed as delta OD450 values versus the delta OD450 values expressed as a percentage of the value for positive-control plasma for tumored and nontumored Floridian (n = 74, left) and Hawaiian (n = 110, right) green turtles assayed for the reactivity of 7S or 5.7S IgY against FUS8 or FUS4.

