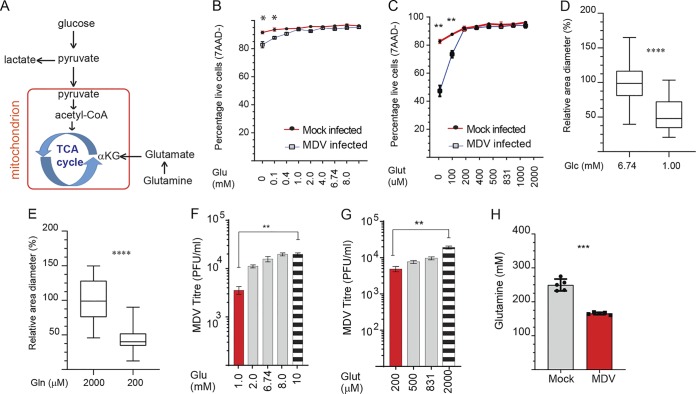
FIG 2.
Glucose and glutamine support MDV infection. (A) Glucose and glutamine utilization in the tricarboxylic acid (TCA) cycle during MDV infection. (B and C) Cell viability of mock-infected or RB1B-infected CEFs at 72 hpi. CEFs were mock infected or infected with RB1B (100 PFU), and the cells were cultured in cell culture medium containing various concentrations of exogenous (B) glucose (0, 0.1, 0.4, 1.0, 2.0, 4.0, 6.74, 8.0, and 10 mM) or (C) glutamine (0, 100, 200, 400, 500, 831, 1,000, and 2,000 μM). Plaque sizes were determined in cell culture medium with (D) low glucose (1.0 mM) or (E) low glutamine (200 μM) or complete medium (2,000 μM and 6.74 mM glucose) at 72 hpi. Plaque sizes are shown as box plots with minimums and maximums (20 plaques were measured for each condition). Analysis of MDV viral titer (PFU/ml) in the presence of exogenous (F) glucose (1.0, 2.0, 6.74, 8.0, and 10 mM) and (G) glutamine (400, 500, 851, and 2,000 μM) at 72 hpi. (H) Glutamine levels in supernatant of mock-infected and RB1B-infected CEFs. All viral titer experiments were performed in 6 replicates, and the data are representative of 3 independent experiments. ** (P = 0.001) and **** (P < 0.0001) indicate a statistically significant difference compared to vehicle-treated cells. NS indicates no significant difference.

