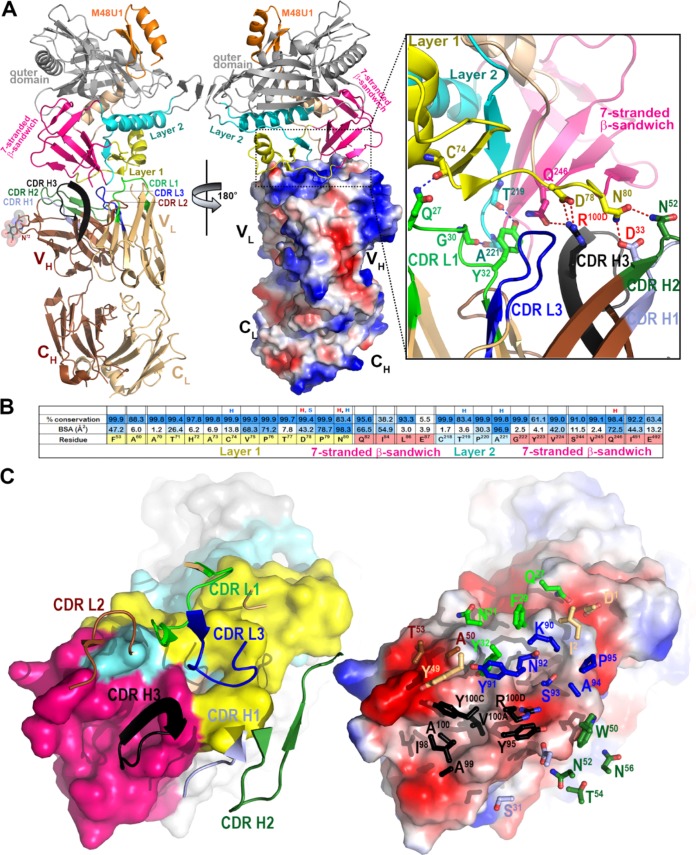
FIG 4.
Crystal structure of the DH677.3 Fab-gp12093TH057 coree-M48U1 complex. (A) The overall structure of the complex is shown as a ribbon diagram (left) with the molecular surface displayed over the Fab molecule (middle), colored based on electrostatic charge: red, negative; blue, positive. The gp120 outer domain is gray and the inner domain colored to indicate inner domain mobile layers 1 (yellow), 2 (cyan), and 3 (light orange) and the 7-stranded β-sandwich (magenta). Complementary determining regions (CDRs) are in the following colors: CDR H1, light blue; CDR H2, dark green; CDR H3, black; CRL1, light green; CDR L2, brown; CDRL3, blue. A blow-up view shows the network of hydrogen (H) bonds formed at the Fab-gp120 interface. H bonds contributed by side-chain and main-chain atoms of gp120 residues are colored magenta and blue, respectively. (B) Fab buried surface area (BSA) and gp120 residues forming DH677.3 epitope are shaded in blue according to BSA (antibody) and percent conservation of gp120 residues (Env). gp120 main-chain (blue) and side-chain (red) hydrogen bonds (H) and salt bridges (S) are shown above the residue. (C) The DH677.3 Fab-gp12093TH057 coree interface. CDRs are shown as ribbons (left) and balls and sticks of residues contributing the binding (right) over the gp120 core. The molecular surface of gp120 is colored as described for panel A (left) and by electrostatic potential (right).

