FIG 3.
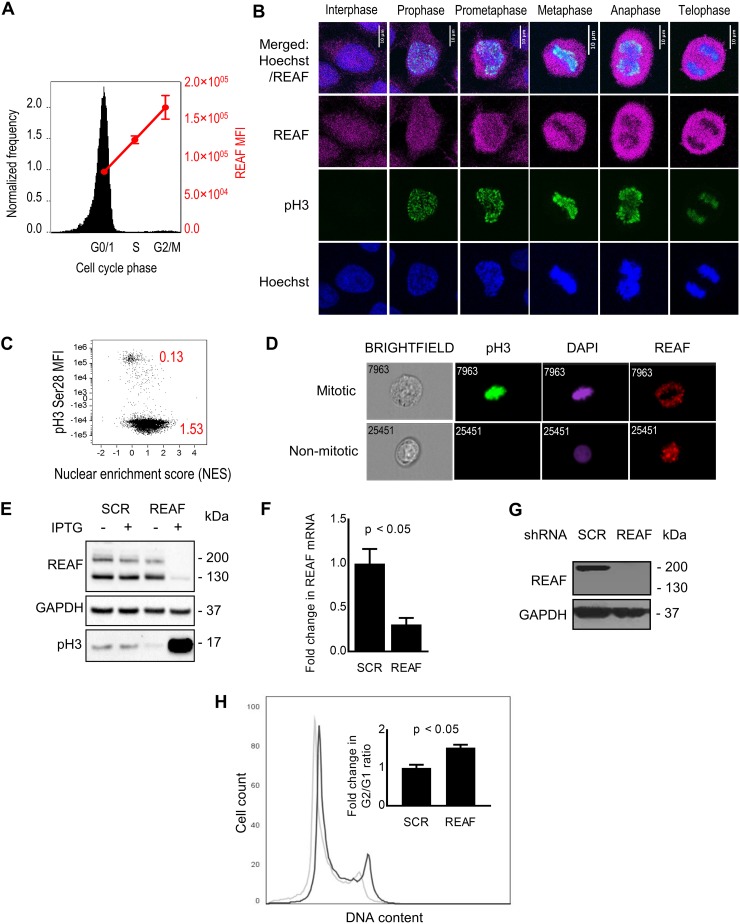
Depletion of REAF and G2/M accumulation. (A) Imaging flow cytometry of cell cycle phase and REAF protein in DAPI-stained primary monocytes. (B) Confocal microscopy of subcellular REAF in HeLa-CD4 cells. Phospho-histone H3 (Ser28) (pH3) staining and chromatin morphology (Hoechst 33342) were used for cell cycle phase identification. (C) Imaging flow cytometry of subcellular REAF in cycling HeLa-CD4 cells. A lower nuclear enrichment score (red) indicates a lower proportion of overall REAF in the nucleus. Phospho-histone H3 (Ser28) staining confirmed that mitotic cells had a lower score of 0.13. (D) Representative images of subcellular REAF in mitotic and nonmitotic cells. (E) REAF protein in THP-1 cells with IPTG-inducible shRNA targeting REAF (shREAF) or a scrambled control sequence (shSCR). Phospho-histone H3 (Ser10/Thr11) was a mitotic marker, and GAPDH was a loading control. (F) Fold change in the mRNA transcript level in PM1 shREAF cells normalized to PM1 shSCR cells as measured by qPCR. (G) REAF protein in PM1 cells expressing shRNA targeting REAF (shREAF) and PM1 cells expressing a scrambled control sequence (shSCR). GAPDH was a loading control. (H) Flow cytometry of cell cycle phase in PI-stained PM1 shREAF (black line) and PM1 shSCR (gray line) cells. The plot is representative of three biological replicates. The inset shows the fold change in the G2/G1 ratio in PM1 shREAF cells normalized to PM1 shSCR cells. The error bars represent standard deviations of the means of three biological replicates.

