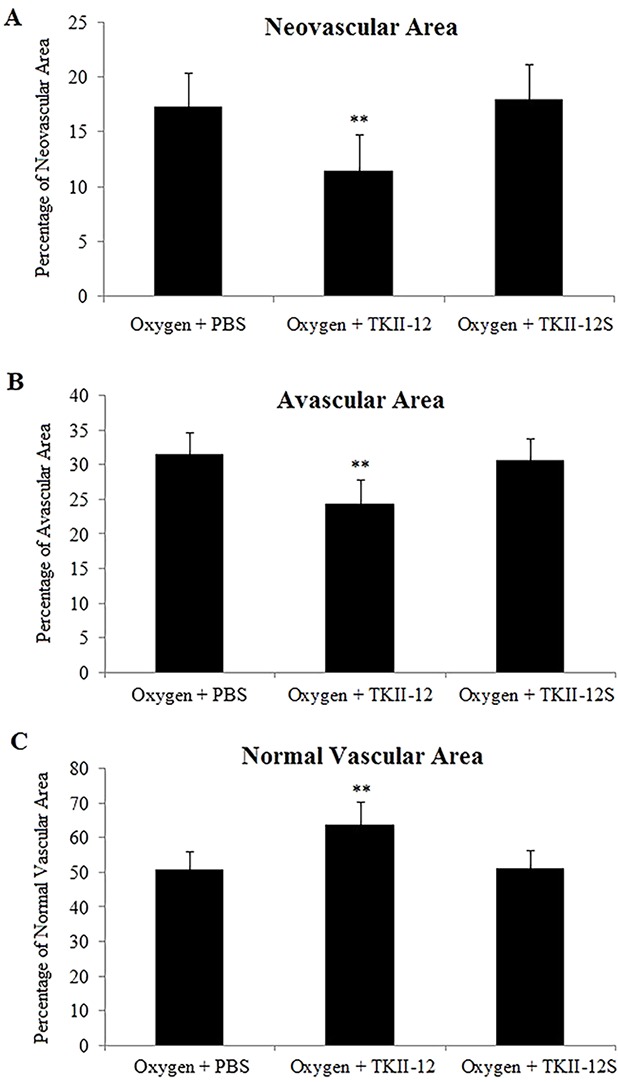
Figure 7.

Quantitative analysis of the effects of TKII-12 on oxygen-induced retinopathy in a mouse model. Quantification of neovascularization (A), avascularization (B), and normal vascularization (C) of each group were performed at P17. **p < 0.01 versus the oxygen plus phosphate-buffered saline (PBS) group.
