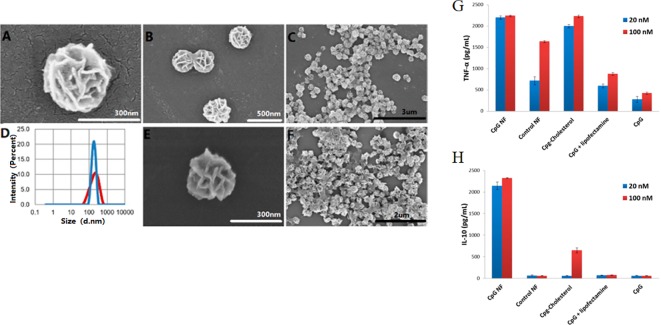
Figure 11.
SEM observation and immunostimulatory function of DNA nanoflowers. (A–C, E–F) SEM images showing structures of nanoflowers at different scales. (D) Distribution of sizes of nanoflowers before (red) and after (blue) treatment with DNase I as measured by DLS. (G, H) Secretion of cytokine secreted by CpG-containing DNA nanoflowers and other control groups [reproduced with permission from (Zhang et al., 2015)].

