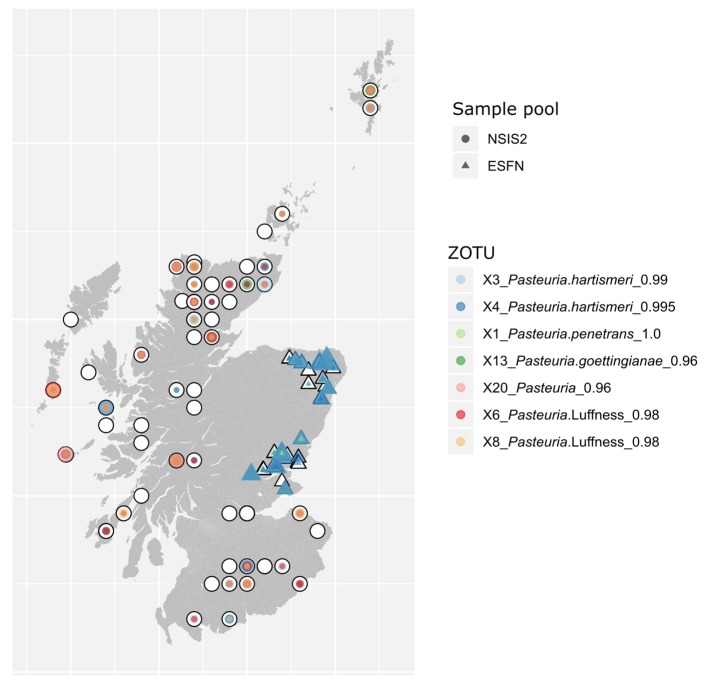
Figure 3.
Map of distribution of the most abundant Pasteuria spp. ZOTUs across both NSIS2 (circles) and ESFN (triangles) datasets. Plot points are colored by ZOTU and sized as a function of the total number of merged read pairs recovered for that ZOTU µl−1 of product added to the final pool from the corresponding sample.

